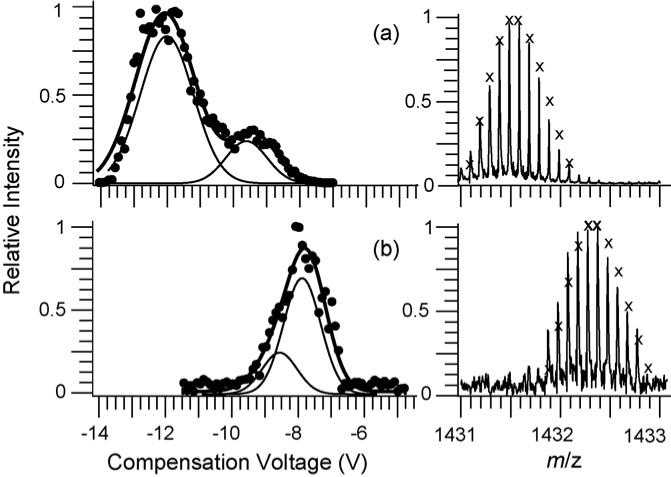
Fig. 8.

CV scans for: (a) fully oxidized and (b) fully reduced lysozyme 10+ from 33.2/66.5/0.3%, by volume, water/methanol/acetic acid solution. The summed Gaussian distribution (solid line) for both scans is comprised of two individual Gaussian distributions (thin solid lines) which are individually plotted lower for clarity. Partial mass spectra (right) show isotope distributions (calculated distributions indicated by “×”) for the 10+ change state indicating an 8 Da mass change upon reduction of the four disulfide bonds.
