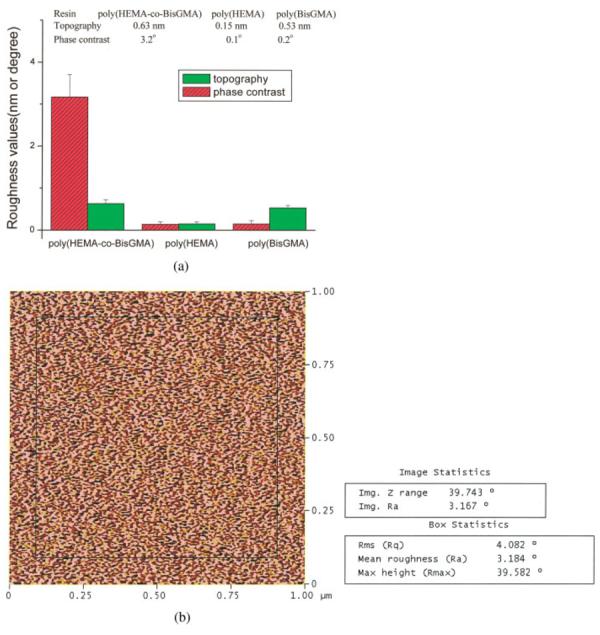
Figure 3.

The calculated roughness values from the height and phase contrast images of model resins cured under cover glass (a). One example was shown for the calculation of phase-contrast using the image software (b). The values of mean roughness were used for analysis. [Color figure can be viewed in the online issue, which is available at www.interscience.wiley.com.]
