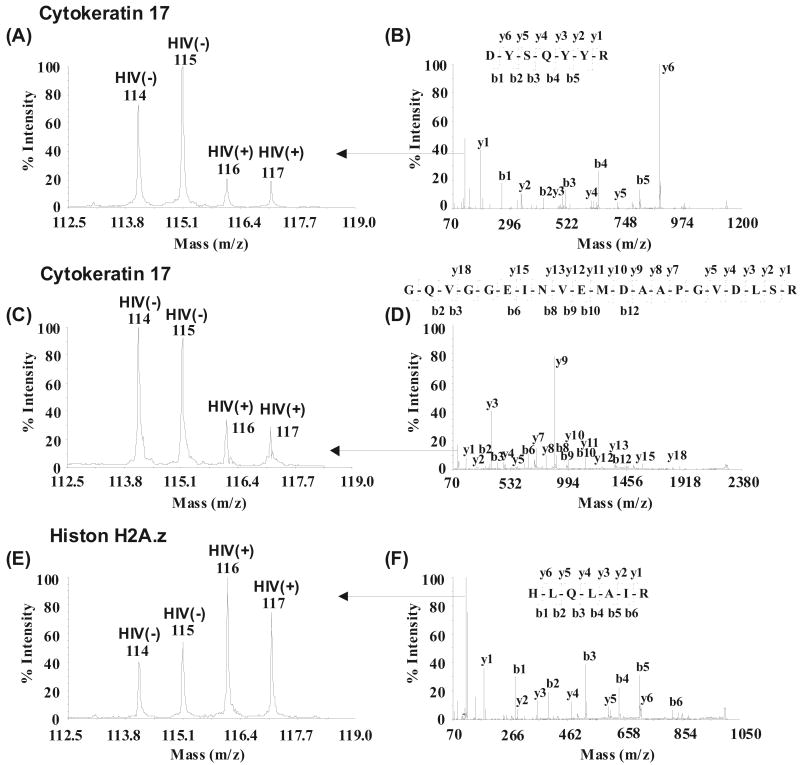
Fig. (1).
Examples of quantification and identification of proteins. Cytokeratin 17 (A-D) was downregulated and histone H2A.z (E and F) was upregulated in HPV(+) HIV(+) samples. Two peptides corresponding to cytokeratin 17 (A and C) are shown to indicate similar trends in peptide quantification. Peptide sequences were deduced from the MS/MS spectra, (B, D and F) based on the observation of continuous series of either N-terminal (b series) or C-terminal (y series) ions. Quantification of peptides was based on the relative iTRAQ reporter peak areas (A, C and E).

