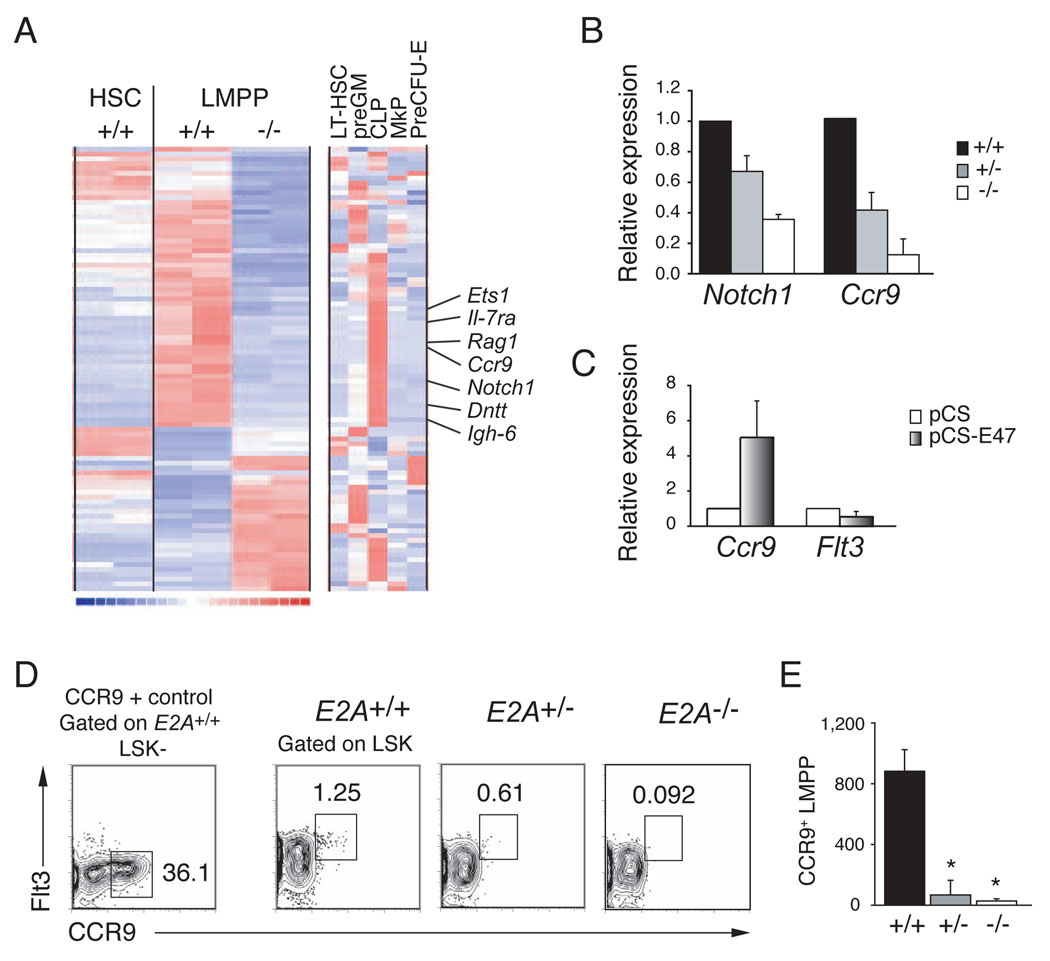
Figure 4. Analysis of the E2A+/+ and E2A−/− LMPP transcriptome.
(A) Clustering of genes that are differentially expressed in replicate samples (one per column) of E2A+/+ and E2A−/− LMPPs (Affymetrix MOE430 2.0 arrays). Expression of these genes in E2A+/+ HSCs is shown for comparison. The clustering includes all genes with expression levels >50 in at least one of the four LMPP arrays and differing by > 2- fold (using a lower 90% confidence bound of fold change). Each row corresponds to one unique identifier and a subset of CLP-associated genes is indicated (see Figure S3 for complete list of genes). The right-most clustering shows the lineage association of these differentially expressed genes in LT-HSC, preGM, CLP, MkP and preCFU-E (as defined in (Pronk et al., 2007b). Red indicates high, blue low, and white intermediate expression levels. (B) Relative expression of Notch1 and Ccr9 mRNA in purified E2A+/− and E2A−/− LMPPs, as compared to E2A+/+ progenitors (normalized to Hprt and set to 1), determined by QPCR. (C) QPCR analysis of Ccr9 and Flt3 mRNA in E2A−/− fetal liver multipotent progenitors, 36 hours after transduction with control or E47 producing retrovirus. (D) E2A+/+, E2A+/− and E2A−/− LSKs analyzed for surface expression of Flt3 and CCR9. CCR9 expression in E2A+/+ LK−S cells is shown for comparison. (E) Absolute number of CCR9+ LMPPs in the BM (femurs and tibias) of E2A+/+, E2A+/− and E2A−/− mice. Bars represent the mean ± SD; * p<0.05.

