
Figure 1.
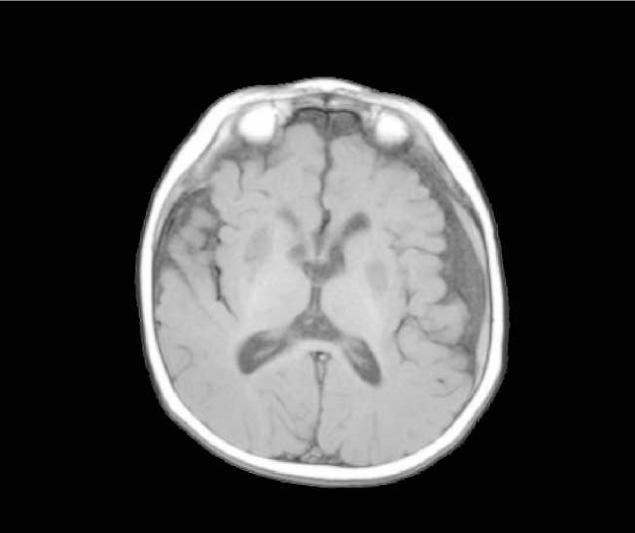
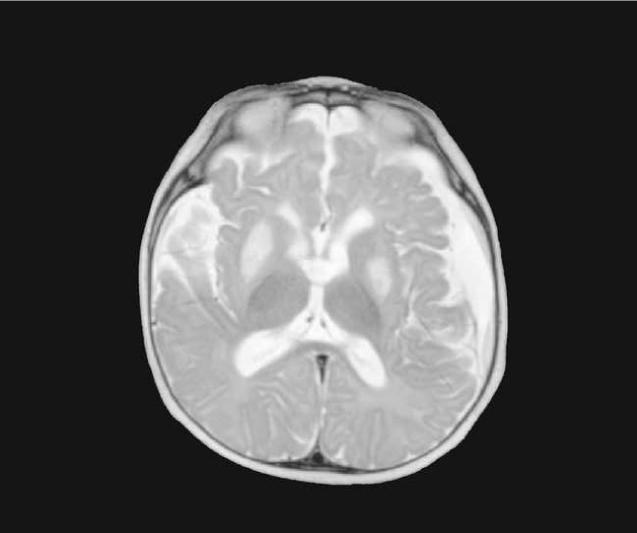
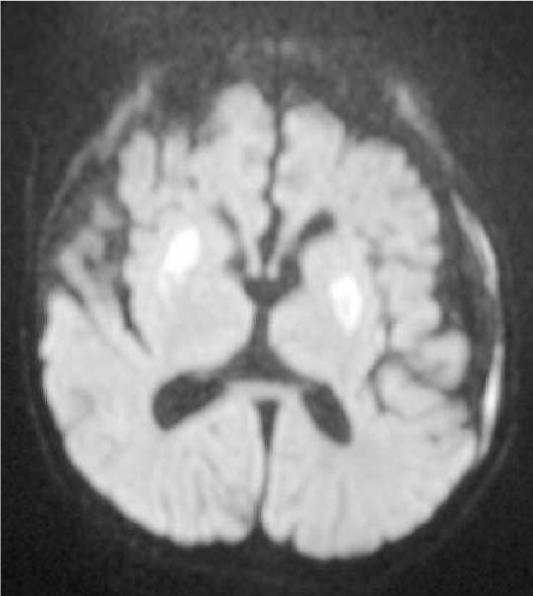
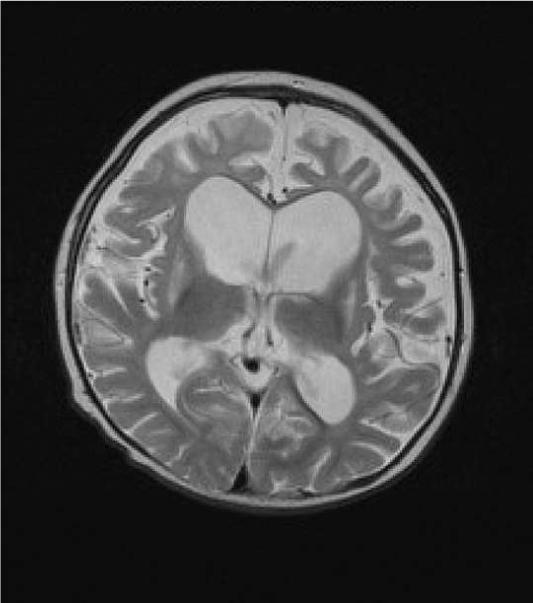
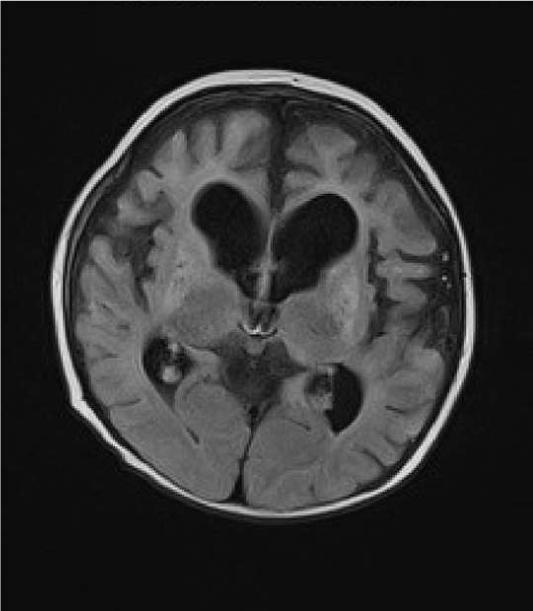
MRI and MRS from a boy with Leigh Syndrome. At 7 months bilateral putamenal lesions demonstrate low signal intensity on T1 weighted (Figure 1A) and hyperintensity on T2 weighted (Figure 1B) images while a diffusion weighted image ( Figure 1C) demonstrates hyperintensity reflecting restricted diffusion typical of acute ischemia in the putamen. Follow up imaging at 19 months demonstrates focal atrophy of the putamen and as well as generalized atrophy on T2 weighted (Figure 1D) and FLAIR imaging (Figure 1E), and increased lactate in the putamen (arrow) on MRS (see figure 8)