
Figure 5.
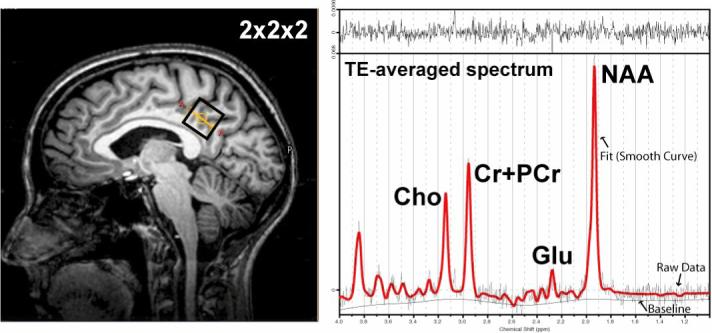
Example 1H TE-averaged data-set collected from a 2×2×2 voxel in the posterior-cingulate cortex at 3T. The commonly observed resonances in the 1H spectrum. Choline containing compounds (Cho), Creatine + Phoshocreatine (Cr+PCr), glutamate (Glu), and N-acetylaspartate (NAA) are shown.