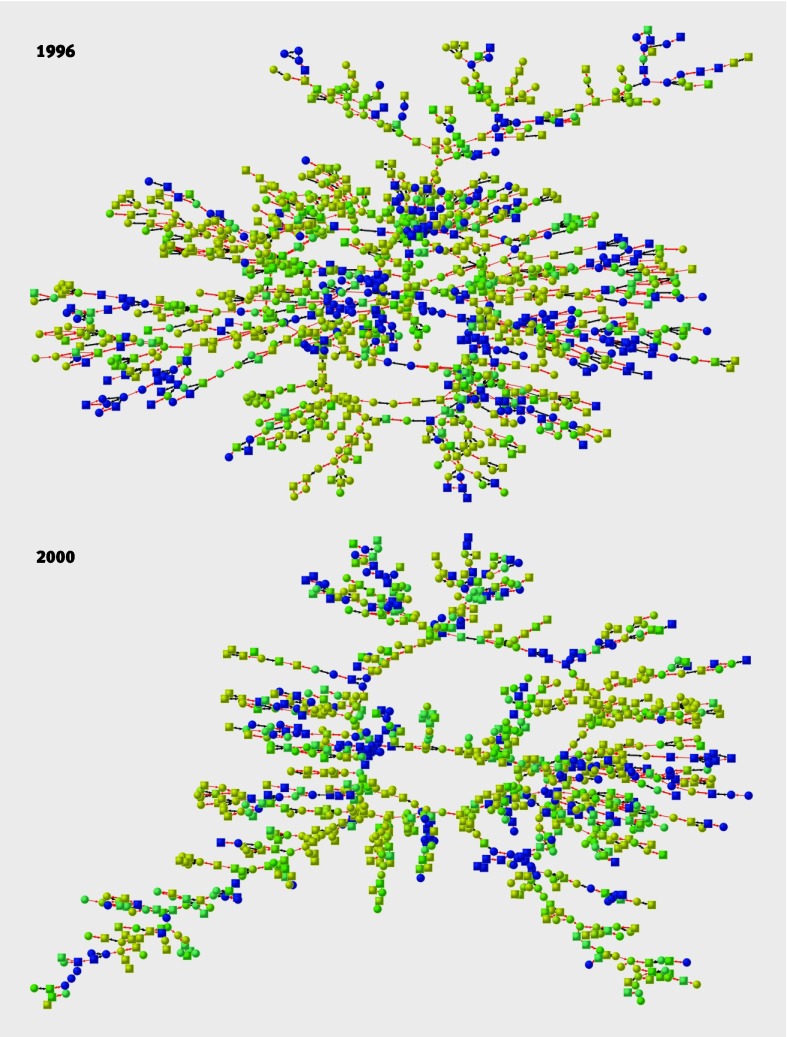
Fig 1 Happiness clusters in the Framingham social network. Graphs show largest component of friends, spouses, and siblings at exam 6 (centred on year 1996, showing 1181 individuals) and exam 7 (year 2000, showing 1020 individuals). Each node represents one person (circles are female, squares are male). Lines between nodes indicate relationship (black for siblings, red for friends and spouses). Node colour denotes mean happiness of ego and all directly connected (distance 1) alters, with blue shades indicating least happy and yellow shades indicating most happy (shades of green are intermediate)

An official website of the United States government
Here's how you know
Official websites use .gov
A
.gov website belongs to an official
government organization in the United States.
Secure .gov websites use HTTPS
A lock (
) or https:// means you've safely
connected to the .gov website. Share sensitive
information only on official, secure websites.
