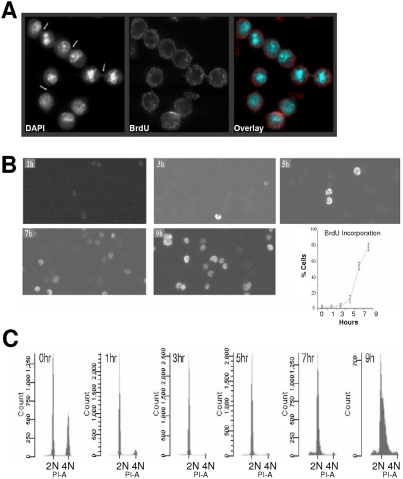
Figure 1. Synchrony in cells collected by mitotic selection.
(A) Synchronous population of CHO cells 1 hour after mitotic selection. Images are displayed in grayscale for DAPI and BrdU uptake (Bromodeoxyuridine) and together as two-color overlay (cyan for DAPI and red for BrdU). The post-mitotic bridge between mitotic doublets is indicated by white arrow. Images were captured using a deconvolution microscope. Each image is a projection of 10 optical sections comprising a total thickness of 2.5 micrometer from the middle of the cell. Identical results are observed with HeLa cells [4]. (B) Entry into S phase by cycling HeLa cells. BrdU uptake by HeLa cells obtained by mitotic selection. 1→9 h indicate time after plating of mitotically selected cells. Graph shows percentage of cells incorporating BrdU at different time points after mitosis. A minimum of 300 cells were counted for each time point from at least eight fields of vision on the fixed slides. (C) FACS analysis of cells selected by mitotic shake-off. Mitotic HeLa cells were collected, plated and then harvested at specific time points. The cells were stained with propidium iodide (PI-A) and analyzed by FACS. BrdU incorporation in Figure 1B and FACS analysis were done in parallel. Each experiment was repeated twice.

