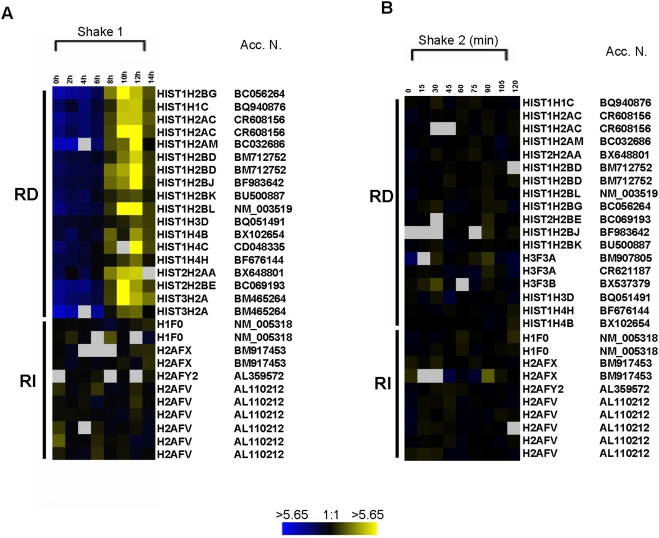
Figure 2. Gene expression profile of human histone genes on human genome-scale (29,000 genes) arrays.
(A) The data shown here is from shake 1 (14 h). (B) Data from shake 2 (2 h). Refer to the text for detailed description of the experiment. The bars on the left separate the replication-dependent (RD) histone gene family from replication-independent (RI) histone genes. RD genes upregulation is indicated by a yellow color. Gray squares represent spots on the array with poor quality that were not considered in the analysis and did not make it to the final cluster image. The data presented here (A and B) is from two independent experiments, using two different sets of mRNAs and microarray slides. The color scale at the bottom indicates fold induction or repression in gene expression. The signal is a direct measure of relative abundance of mRNA sample from control and experimental samples. The gene symbols and accession numbers displayed are generated from SMD and S.O.U.R.C.E online tool. Gene symbols are represented close to the cluster image. The accession numbers (Acc. N.) are displayed far right to the image.

