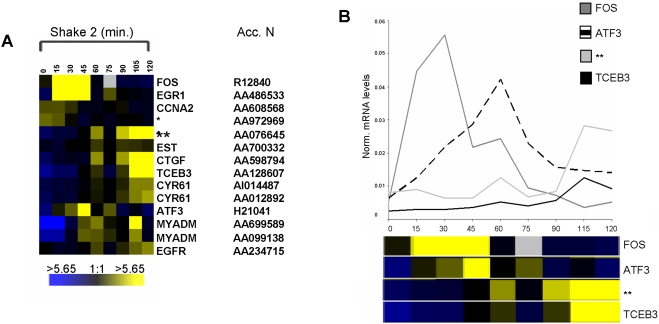
Figure 5. Gene activity during the first 2 hours of G1 phase in HeLa cells.
(A) Expression profile of selected G1-regulated genes out of the list of 200 (see supplementary Table S1). The data shown here is derived from mRNAs collected at 15 min intervals over the first 2 hours after plating, in early G1. The analysis performed here is as in Fig. 2. For more information on how these genes were identified, refer to the methods section. (B) Quantitative RT-PCR analysis of candidate RNAs in synchronously growing cells in early G1 by real-time amplification (BioRad). The graph generated represents normalized mRNA levels of each gene under study relative to actin and the bar below each graph outlines the array expression patterns of candidate genes shown in (A). The values on the Y-axis are arbitrary and are the results of normalizing to α-actin RNA levels in the same sample. Refer to (A) for comparison – yellow represents high and blue low level of expression. Gene symbols are shown, (*) (**) hypothetical protein, (Acc. N.) accession number.

