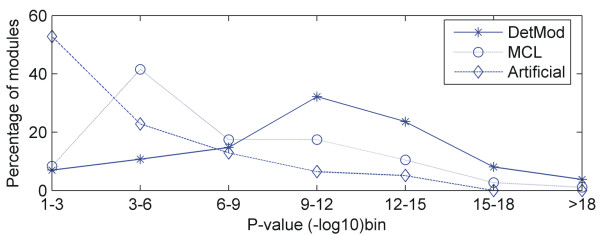
Figure 2.
In this diagram the functional enrichment of modules in biological process GO terms is checked by means of p-value. As the p-value bin gets larger the more robust is a module with regard to the biological process it carries out. It is evident that the majority of control modules have p-value bins ranging between 1–12, while DetMod modules between 9 and 18.

