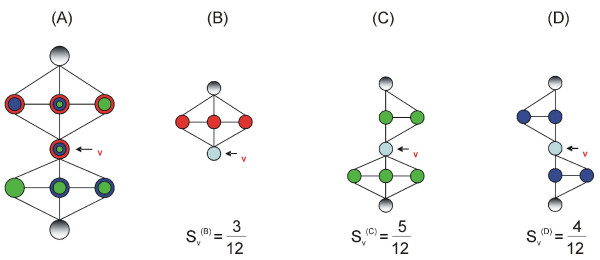
Figure 5.
In this figure we describe an example of the score we set to a certain node v. In (A) we can depict the real neighborhood of v. The sub-figures in the left (B-D) are three possible modules that could be extracted from the main graph in (A). According to the neighbors of v present in each one of the modules we set a score for v in the specific module. The scores are normalized so as to have sum equal to unity. It is clear that the best score for node v is for sub-figure (C), since in this module v is connected to the majority of its neighbors.

