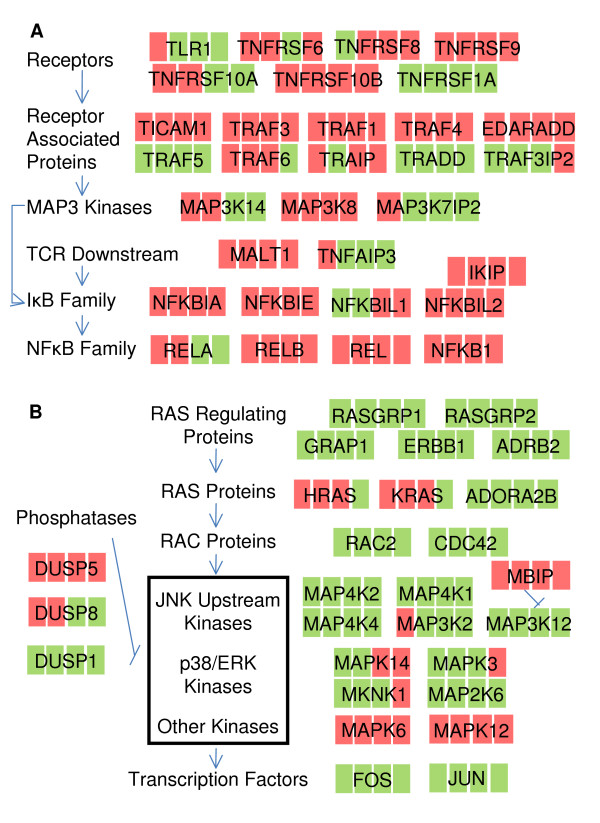
Figure 4.
Pathway schematic of significantly regulated genes in (A) NF-κB signalling and (B) MAP kinase signalling. Membership was manually determined from the corresponding gene pages in NCBI [18] and references therein. The regulation of gene transcription in CD3+ T cells, compared to 0 hour, is denoted by different color (green: downregulation, red: upregulation) at each timepoint in the sequence of 4, 10, 48 and 96 hours.

