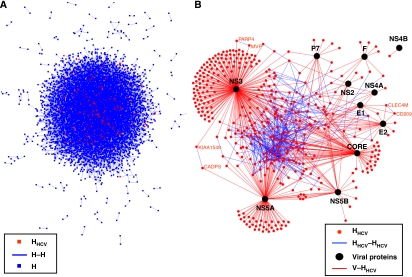
Figure 2.
Graphical representation of the HCV–human interaction network. (A) Graphical representation of H–H network. Each node represents a protein and each edge represents an interaction. Red and blue nodes are HHCV and HNot-HCV, respectively. (B) Graphical representation of V–HHCV interaction network. Black node: viral protein; red node: human protein; red edge: interaction between human and viral proteins (V–HHCV); blue edge: interaction between human proteins (HHCV–HHCV). The largest component containing 196 proteins is represented in the middle of the network. Names of cellular proteins belonging to the three other connected components are also represented.

