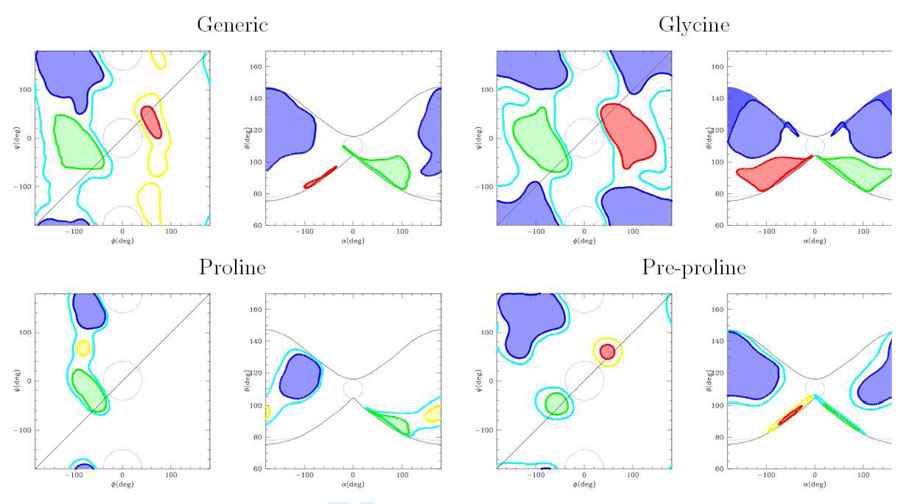
Figure 3.
Mapping of the Ramachandran plot onto the α, θ plane for different aminoacid types. The “core regions” are in green (right handed helices), red (left handed helices), blue (sheets). The allowed regions (yellow and cyan) are omitted in the Generic and Glycine α, θ plot for clarity. Forbidden regions are enclosed in the dotted lines. The contours of the “butterfly” image are reported as black lines in the α, θ plane. The input data for the Ramachandran plot are taken from the Protein Data Bank[18].

