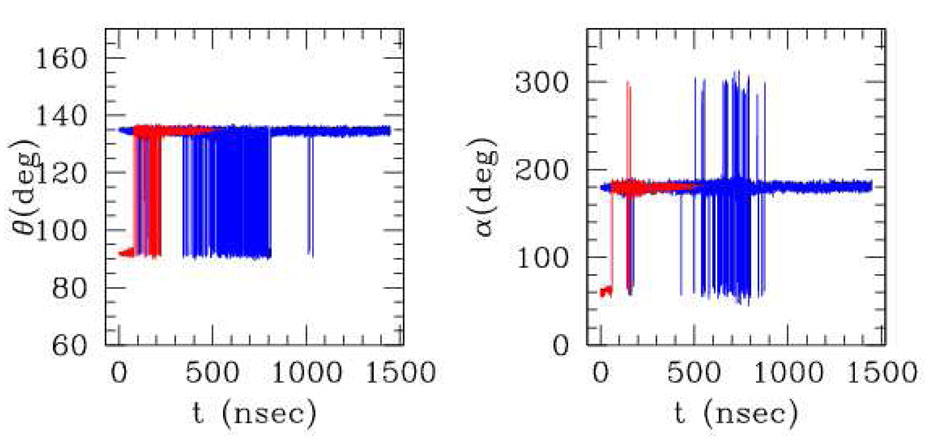
Figure 7.
“Representative values” of bond angles and dihedrals evaluated during the simulations starting from the α helix (red) and from the extended structure (blue). The “representative value” is evaluated as follows. For θ: for each timestep, all the 18 θ angles along the chain are measured, and two average values are calculated, one for the “extended” and one for the “helical” (conventionally separated by the value 113 deg). The representative value for θ is then chosen as the (average) value of the the most populated structure, for each timestep. For α: same procedure, except that in this case three separate average values are calculated for right handed (between 0 and 115 deg) or left handed helices (between −115 and 0) and for extended (otherwhise).

