
Figure 1. Expression of c-Myb and other megakaryocytic transcription factors in megakaryocytic cell lines and mature megakaryocytes.
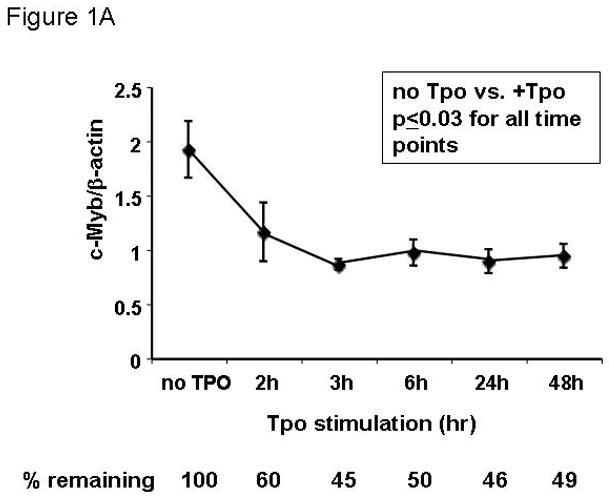
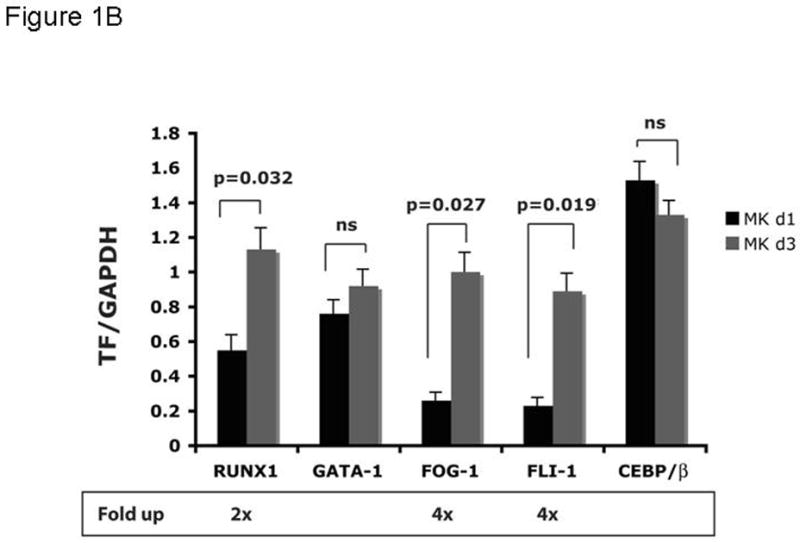
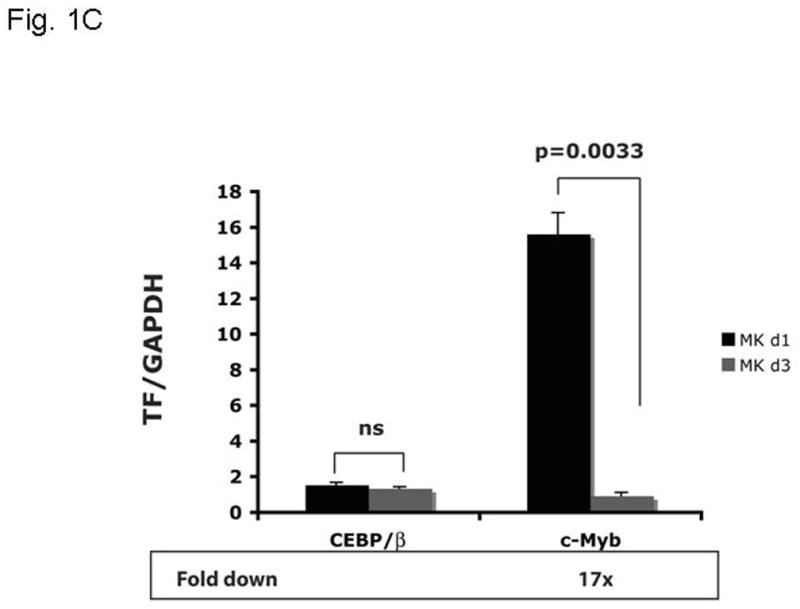
UT7/TPO cells (A) were starved for 24h and then stimulated with 100 ng/ml thrombopoietin for up to 48 hr. RNA was extracted and c-Myb levels were assessed by Q-RT-PCR, with β-actin as internal control. Each assay was performed in triplicate. c-Myb levels significantly declined (p≤0.03) for all time points with Tpo stimulation (n=3). Immature murine megakaryocytes (B–C) were induced to differentiate over 2 days with thrombopoietin. RNA was harvested from immature and mature megakaryocytes, and the levels of RUNX1, GATA1, FOG1, Fli1, C/EBPβ and c-Myb were assessed by quantitative real-time PCR with glyceraldehyde dehydrogenase (GAPDH) as an internal control. The results shown are the relative values of signal intensity for the various transcription factors compared to the internal controls. Each experiment was performed in triplicate and the results compared using the t-test for paired values. The results represented in figures 1B and 1C were performed together, but are shown on separate figures due to the range of scales.