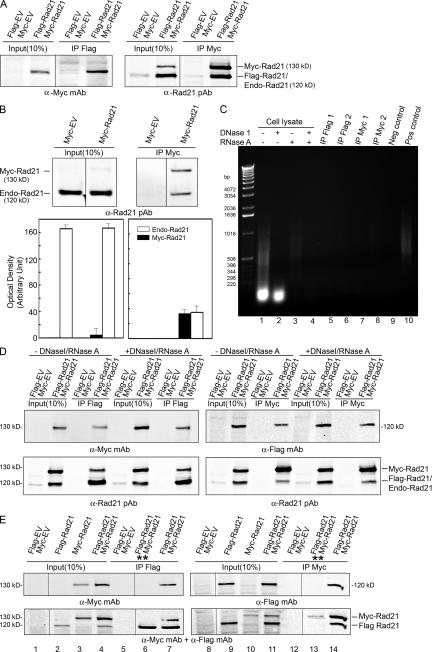
Figure 1.
Co-IP and WB analysis of cohesin Rad21–Rad21 interaction. Logarithmically growing 293T or HeLa cells were transfected with appropriate Rad21 plasmids or empty vector (EV). Input (10% of IP) and IP samples were resolved by 7% SDS-PAGE and blotted with the indicated anti-bodies. (A) Flag-Rad21 and Myc-Rad21 coimmunoprecipitated. (B) Myc-Rad21 coimmunoprecipitated endogenous Rad21. Bar graphs show the relative level of Myc-Rad21 and endogenous Rad21 in input (left) and co-IP samples (right). Error bars indicate SEM from three observations. (C) Radom primer PCR amplification of DNA from 293T cell lysates and the elutes of immunoprecipitated samples. The template DNA used for PCR was purified from cell lysates after nuclease treatment as shown in lanes 1–4. The cell lysates for IP with Flag mAb (lanes 5 and 6) or Myc pAb (lanes 7 and 8) agarose-conjugated beads were digested with DNase I and RNase A in lanes 5 and 7 but were not digested in lanes 6 and 8. The amounts of DNA template used for PCR were from 125 μg of protein of cell lysates (lanes 1–4) or 1 mg of protein of cell lysates in IP samples (lanes 5–8). There is no DNA in the negative control (lane 9) and 0.25 ng DNA in the positive control (lane 10). (D) Cell lysates were treated with or without DNase I and RNase A before co-IP. (E) Co-IP of Flag-Rad21 and Myc-Rad21 from cells in which Flag-Rad21 and Myc-Rad21 were expressed separately, and lysates were mixed together before IP was performed (**, lanes 6 and 13) or from cells cotransfected with Flag-Rad21 and Myc-Rad21 (lanes 7 and 14). Black lines indicate that intervening lanes have been spliced out.

