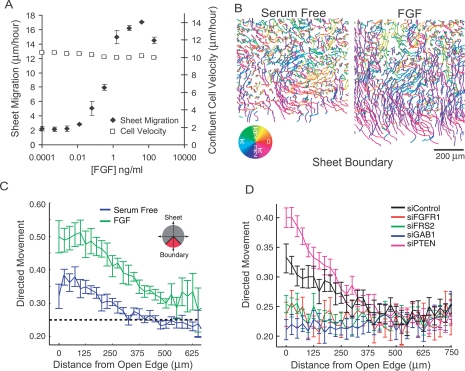
Figure 4.
Molecular basis for directed migration into cell-free space. (A) Dose response curve relating sheet migration (black diamonds) to individual cell velocities in an unperturbed sheet (white squares) in response to varying concentrations of FGF (n = 3, error bars represent standard error of the mean). (B) Representative cell tracks near an open edge for monolayers treated with FGF (right panel) or serum-free media (left panel) colored according to the direction of movement. (C) Quantification of traces in (B) where fraction of cell movements oriented toward cell-free space (directed migration) is calculated as a function of distance from the open edge in the presence (green) or absence (blue) of FGF. (D) Same as C where monolayers are tracked in the presence of FGF and transfected with siRNA targeting various FGF-related signaling genes previously classified as being part of the directed migration module.

