Figure 3.
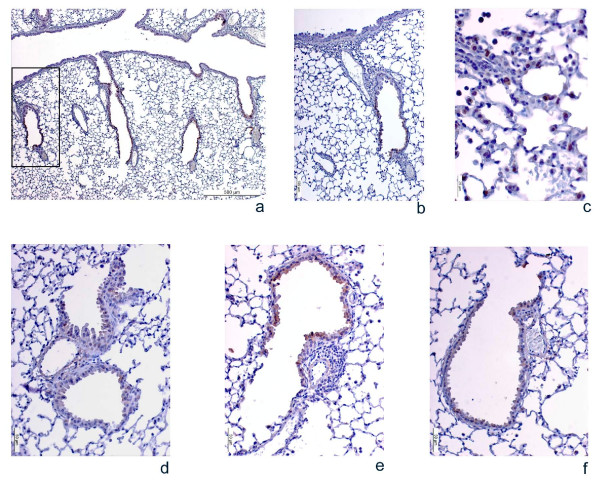
Photomicrographs of COX-2 immunolabeling in lung samples from HDM-sensitized mice following different treatments. Pictures a, b, and c show representative images of the COX-2 immunostaining pattern in the airways. Since the COX-2 distribution was almost the same in all 4 experimental groups, only representative images of one of them are included. 3 (a) shows a general view of COX-2 distribution in the airways, where labeling is detected in the bronchiolar epithelium but not in the principal airway. 3 (b) shows a single bronchiole (magnified view of the area outlined in [a]), and 3 (c) shows stained alveolar macrophages. Pictures d, e, and f reflect the consistent changes in the COX-2 antigen signal intensity under different experimental conditions. 3 (d) shows a single bronchiole from a non-sensitized mouse, 3 (e) A single bronchiole from a sensitized mouse treated with control mismatched oligonucleotides (MM), and 3 (f) COX-2 protein expression in the airways after treatment with the COX-2 antisense oligonucleotide (ASO). Similar staining intensity was seen in untreated sensitized mice, in which cells were heterogeneously labeled and peribronchial and perivascular inflammation was observed, but the immunostaining signal diminished clearly and consistently in the treatment group.

