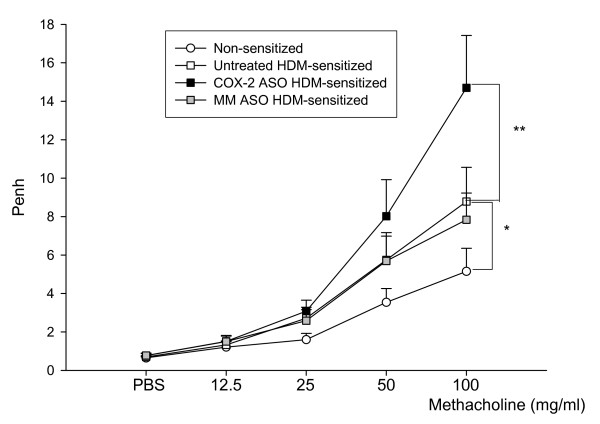
Figure 4.
Airway reactivity to increasing concentrations of aerosolized methacholine. Airway reactivity is shown in non-sensitized mice (white circles), untreated sensitized mice (white squares), control mismatched oligonucleotide-treated sensitized mice (grey squares), and selective COX-2 antisense sensitized mice (black squares). Two-way analysis of variance was used to compare the curves. The COX-2 antisense oligonucleotide (ASO)-treated mice showed a significant increase in AHR to methacholine compared with both untreated and control oligonucleotide-treated sensitized mice. Data are shown as the mean ± SEM (**p < 0.01, ***p < 0.005). ASO: antisense oligonucleotide, MM: mismatched oligonucleotide (n = 12).

