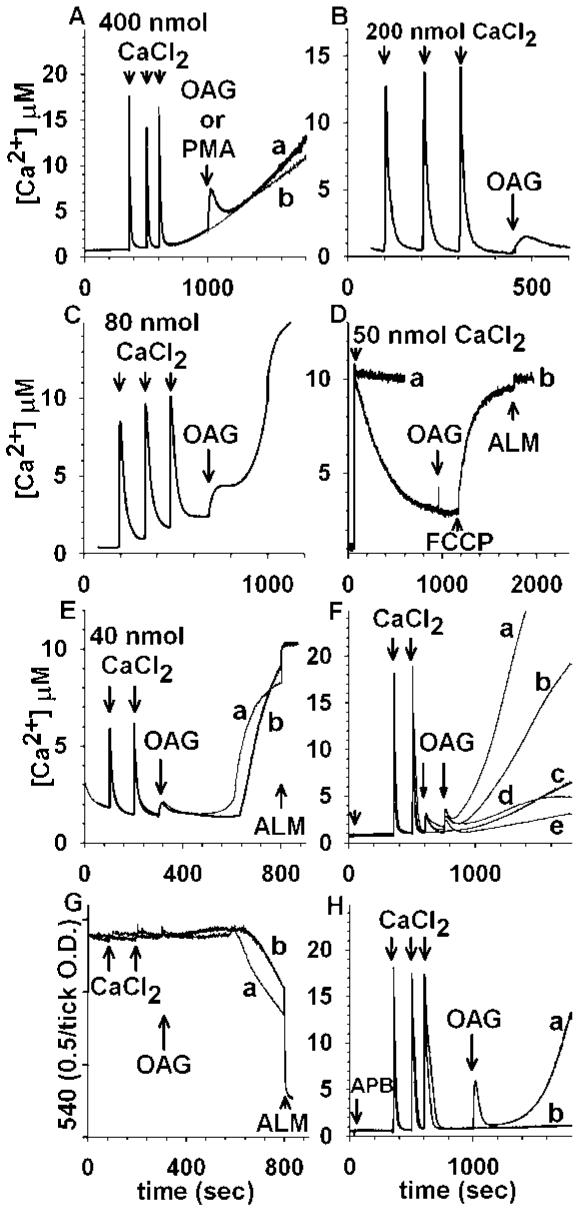
Fig. 1.

OAG induces mitochondrial Ca2+ efflux and its relation to the permeability transition. Release of sequestered Ca2+ from rat brain (A, trace a), mouse kidney (B), mouse heart (C), and rat liver (E), but not sweet potato (D) mitochondria by the diacylglycerol analogue, OAG (100 μM). The phorbol ester PMA (1 μM) fails to induce Ca2+ release (A, trace b). In (D) trace a, Ru360 (165 nM) was present before addition of CaCl2; in trace b,1 μM FCCP was added at 1200 s. (E): Rat liver mitochondria are loaded with two pulses of CaCl2 (100 and 200 s, 40 nmol each) in the absence (trace a) or presence of Cys A (1 μM, trace b), followed by addition of 100 μM OAG at 300 s. At approximately 600 s, mitochondria spontaneously release Ca2+. Alamethicin (40 μg/ml) was added at 800 s. (F): PTP inhibitors do not affect the initial OAG-induced Ca2+ efflux, but modulate the secondary rise: Rat brain mitochondria were loaded with two pulses of CaCl2 (350 and 500 s, 400 nmol each) followed by addition of OAG (50 μM) in the presence and absence of Cys A (2 μM) or BKA (20 μM) or 2-APB (100 μM) (each added at 50 s, small arrow). In trace a, mitochondria were not pretreated with either PTP inhibitor; trace b, Cys A is present; trace c, mitochondria were not challenged by OAG (replaced with vehicle); trace d, mitochondria were pretreated with 2-APB; trace e, mitochondria were pretreated with BKA. (G): OAG does not evoke an immediate large-amplitude swelling in Ca2+ -loaded rat liver mitochondria: Mitochondria were loaded with Ca2+ exactly as in (A) in the absence (trace a) or presence of Cys A (1 μM, trace b), followed by addition of 100 μM OAG at 300 s, and light scatter was followed spectrophotometrically. At approximately 600 s, mitochondria spontaneously swell. Alamethicin (40 μg/mL) was added at 800 s. (H): 2-APB does not inhibit the initial OAG-induced Ca2+ release. Rat brain mitochondria were loaded with three pulses of CaCl2 (350, 500, and 600 s, 400 nmol each) followed by addition of OAG at 1000 s in the presence of 2-APB (100 μM, added at 50 s). Trace a,OAG (100 μM) was added at 1000 s; in trace b, no OAG was added (replaced by vehicle). Traces for this and all subsequent figures are representative of at least four independent experiments unless otherwise indicated.
