
FIG. 6.
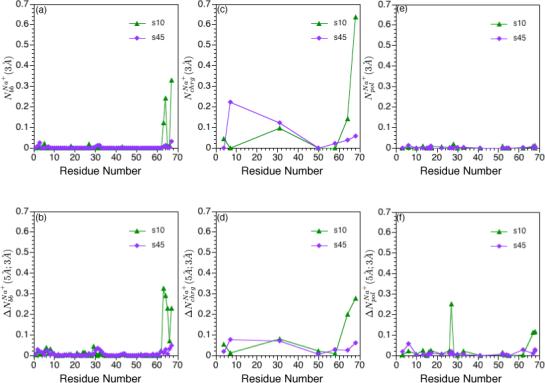
Integrated ion-site radial distribution functions for Na+ ions relative to charged residues, polar residues and backbone atoms of hLtn at different simulation conditions (see Table I). (a) First and (b) second peak integration for Na+ around backbone carbonyl oxygen atoms; (c)-(d): the same set for Na+ around terminal atoms of negatively charged residues (Oδ1 and Oδ2 for Asp and Oε1 and Oε for Glu); (e)-(f): the same set for Na+ around atoms in the polar sidechains. The integration limits are taken to be 3 Å and 5 Å because they are the approximate locations for the first and second minima in the Na+ radial distribution functions around different protein sites. See Computational Methods for protein atoms used in the analysis; note that for (c) and (d), both oxygens of the negatively charged carboxyl end group are used for Asn 68.