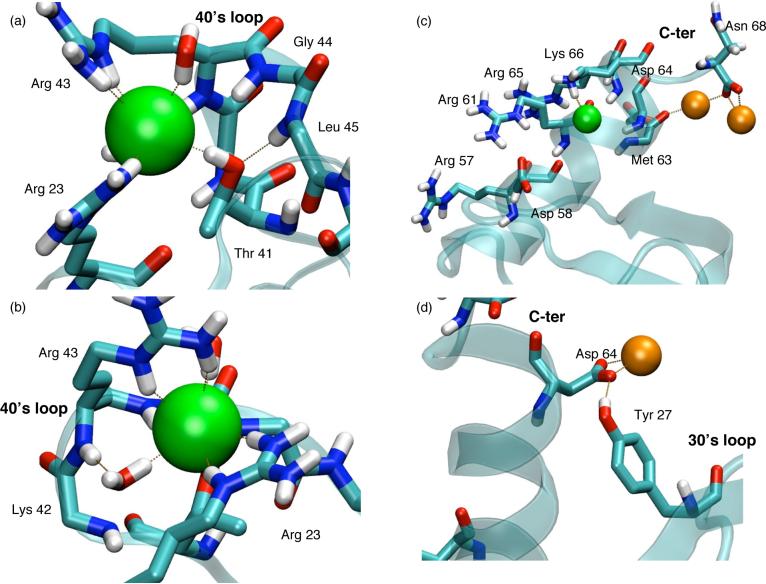
FIG. 7.
Snapshots that illustrate the various binding modes for ion-protein interactions observed in different simulations. Chloride and sodium are colored green and orange, respectively; carbon is light blue, oxygen is red, nitrogen is dark blue and hydrogen is white, for which only the polar hydrogens are shown. (a) and (b) display the same snapshot from the end of the s45 simulation around the 40's loop. Residues Arg 23, Thr 41 and Arg 43 are represented by all atoms while only the backbone atoms are shown for Lys 42, Gly 44, Leu 45 and Lys 46. (c) and (d) display two separate snapshots of the s10 simulation at 8.66 and 14.47 ns into the simulation, respectively. The labeled residues display all the atoms, except Met 65 for which only the backbone atoms are shown in (c).

