FIG. 8.
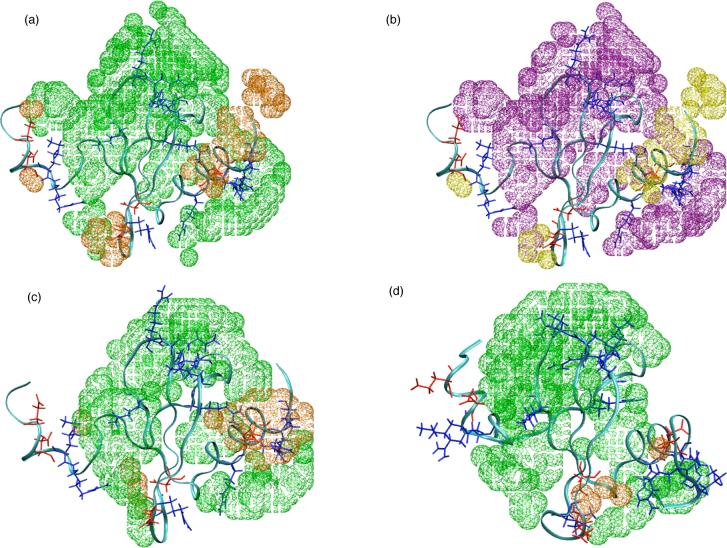
Three dimensional ion distribution and the effect of temperature based on non-linear Poisson-Boltzmann (PB) calculations. (a) Predicted change in the ion distribution around a randomly selected s10 snapshot as temperature increases from 10 to 45 °C; based on PB calculations in which the dielectric constant of water is taken into account (see Computational Methods); distribution of both ions around the protein are found to increase as the temperature increases. The cutoff value for display (in δρ) is 0.03 ρ(∞), where ρ∞)=200mM. Green and orange indicate Cl− and Na+, respectively; positively charged sidechains (Arg and Lys) are colored blue and negatively charged sidechains (Asp, Glu) are colored red. (b) The same plot as (a), except that the temperature dependence for the dielectric constant of water is not considered in the PB calculations; purple and yellow indicate Cl− and Na+, respectively, and both distributions decrease as the temperature increases. The cutoff value for display (in δρ) is −0.08 ρ(∞). (c)/(d) Salt distribution at 10/45°C averaged over 200 snapshot from the s10/s45 trajectory; the same color coding as in (a) is used. The cutoff value for display (in ρ) is 6 times of the bulk salt concentration ρ(∞). Note that a higher degree of Na+ accumulation is found in the C-terminal helical region at the lower temperature.

