
Figure 4.
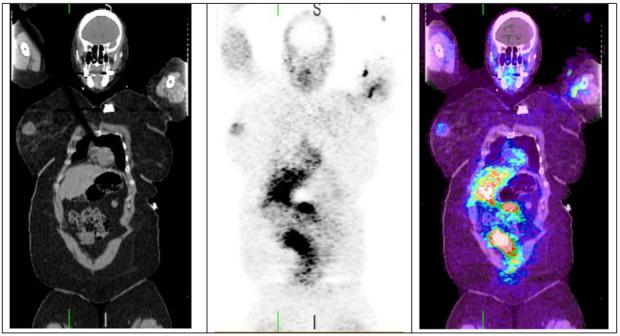
Coronal FPAC PET/CT images, from a patient with a 2 cm right breast mass which showed a complete clinical response to chemotherapy. Significant FPAC uptake is seen in the right breast mass. Due to the hepatic metabolism, there is intense physiologic accumulation of activity in the liver and bowel. Images were acquired ∼3 hours after injection of 5.25 mCi FPAC.