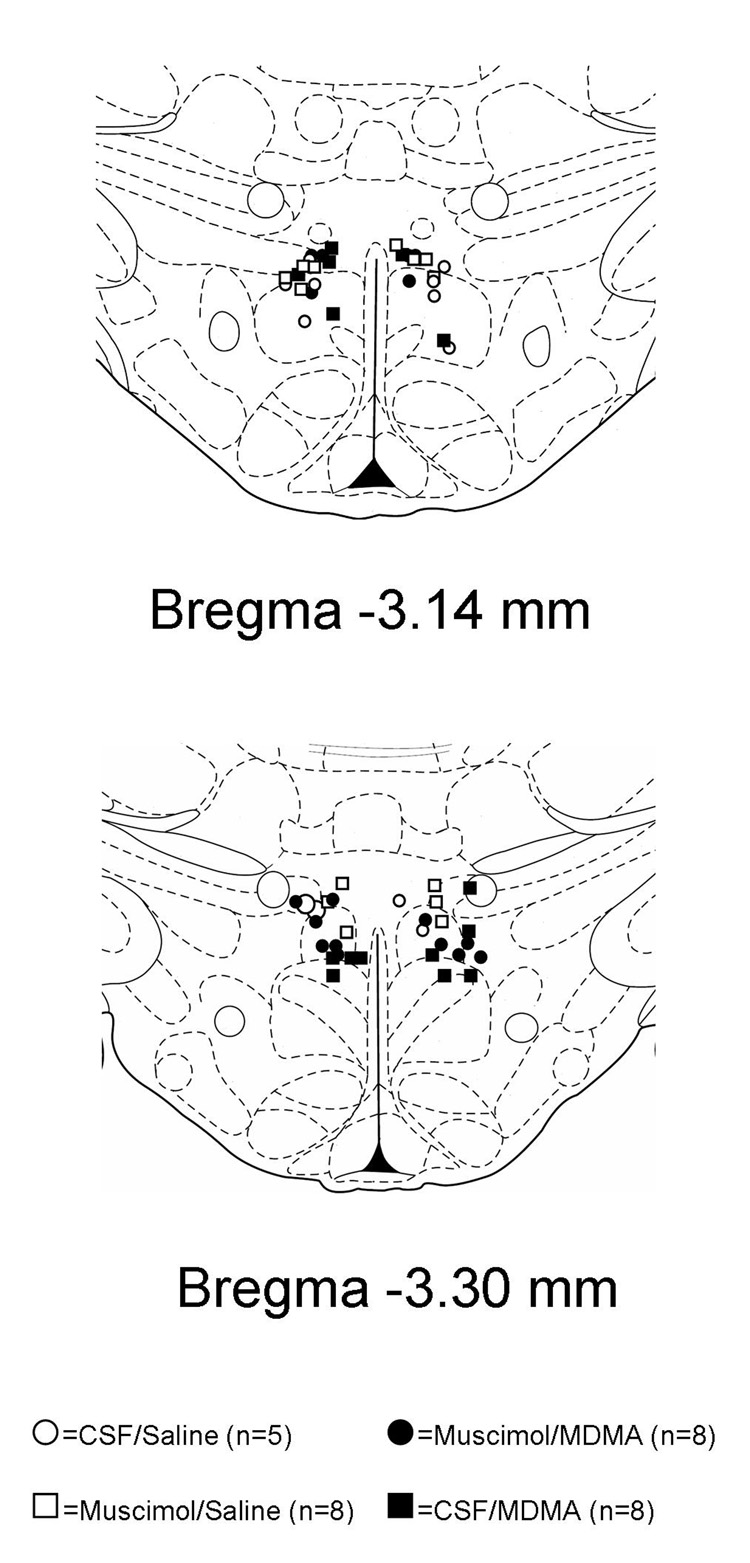
Figure 3. Sites of injection into the DMH.
Schematic coronal sections of the rat brain adapted from the atlas of Paxinos and Watson (1998) illustrating approximate sites of injections into the DMH. Numbers indicate distance from bregma in millimeters. Open symbols represent experiments in which animals were infused with intravenous saline after microinjections of 100 nl of CSF (open circles) or 80 pmol of muscimol (open squares) into the DMH. Filled symbols represent experiments in which animals were infused with intravenous MDMA (7.5 mg/kg) after microinjections with either 100 nl of CSF (closed circles) or 80 pmol of muscimol (closed squares). The numbers of animals in each group is given in parenthesis.

