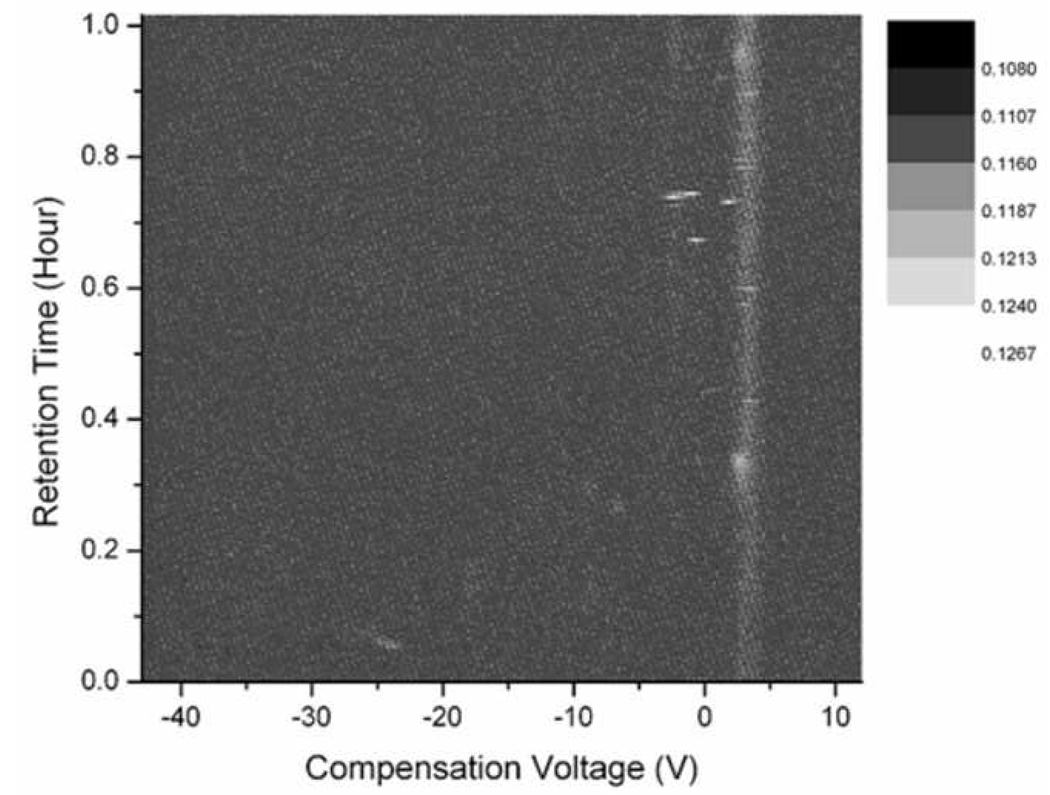
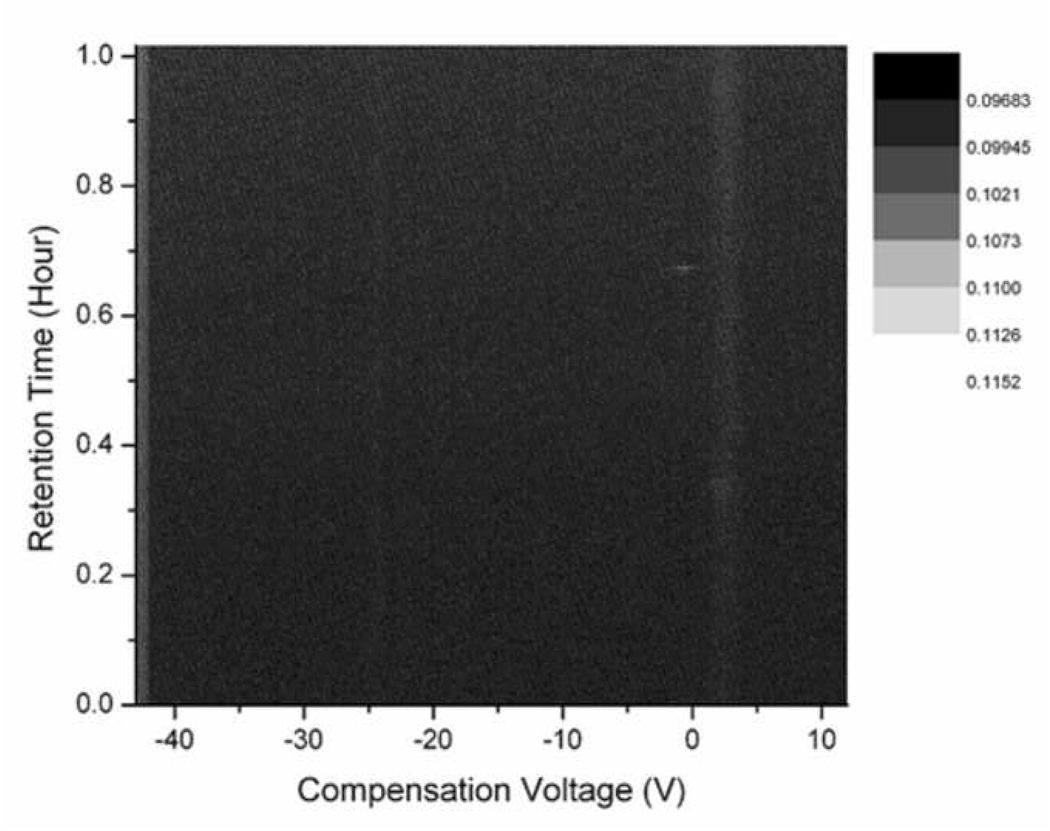
Figure 2. Exhaled breath condensate (EBC) samples spiked with acetone as measured by GC/DMS.
Both positive (top panel) and negative (bottom panel) ion spectra are shown as representative data plots. Color intensity of the points in the spectra indicate chemical abundance, and the chemicals are resolved along both the time and compensation voltage axes by both the gas chromatograph and the differential mobility spectrometer, respectively.


