
Figure 1. Total HIV Risk Behaviors and Subscale Risk Behaviors.
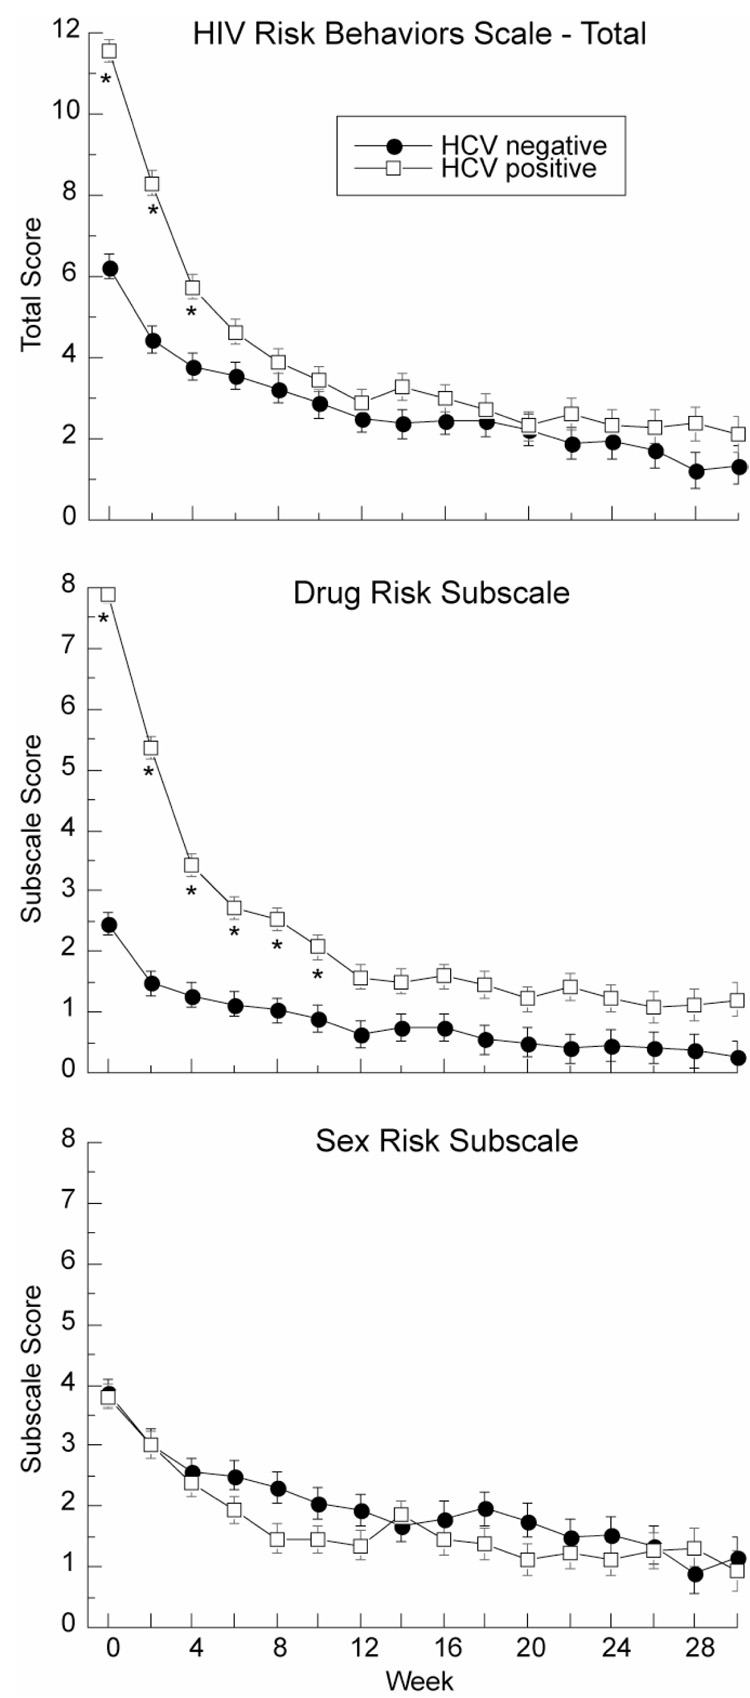
Total HIV risk behavior scores (top panel), drug risk behavior scores (middle panel) and sex risk behavior scores (bottom panel) from the HIV Risk Behavior Scale in HCV-positive (N=356) and HCV-negative (N=291) participants at screening (week 0) and during treatment. Asterisk indicates weeks at which total score for HCV-positive and HCV-negative participants were significantly different (p<.05). Higher scores indicate greater frequency of risky behaviors.