
Fig. 3.
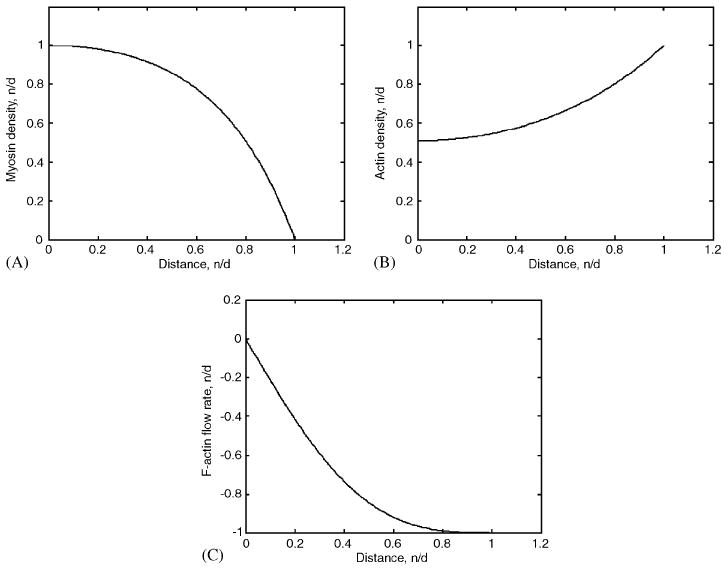
(A) Asymptotically stable stationary distributions of bound myosin (b(x)), (B) F-actin (a(x)), and (C) F-actin flow rate (υ(x)), across half of the non-motile contracting strip. The densities are normalized by their maximal absolute values. One unit of distance corresponds to 10 μm; x = 0 and x ≈ 1 correspond to the middle and right edge of the strip, respectively. The actin and myosin densities are even functions, the flow rate is an odd function.