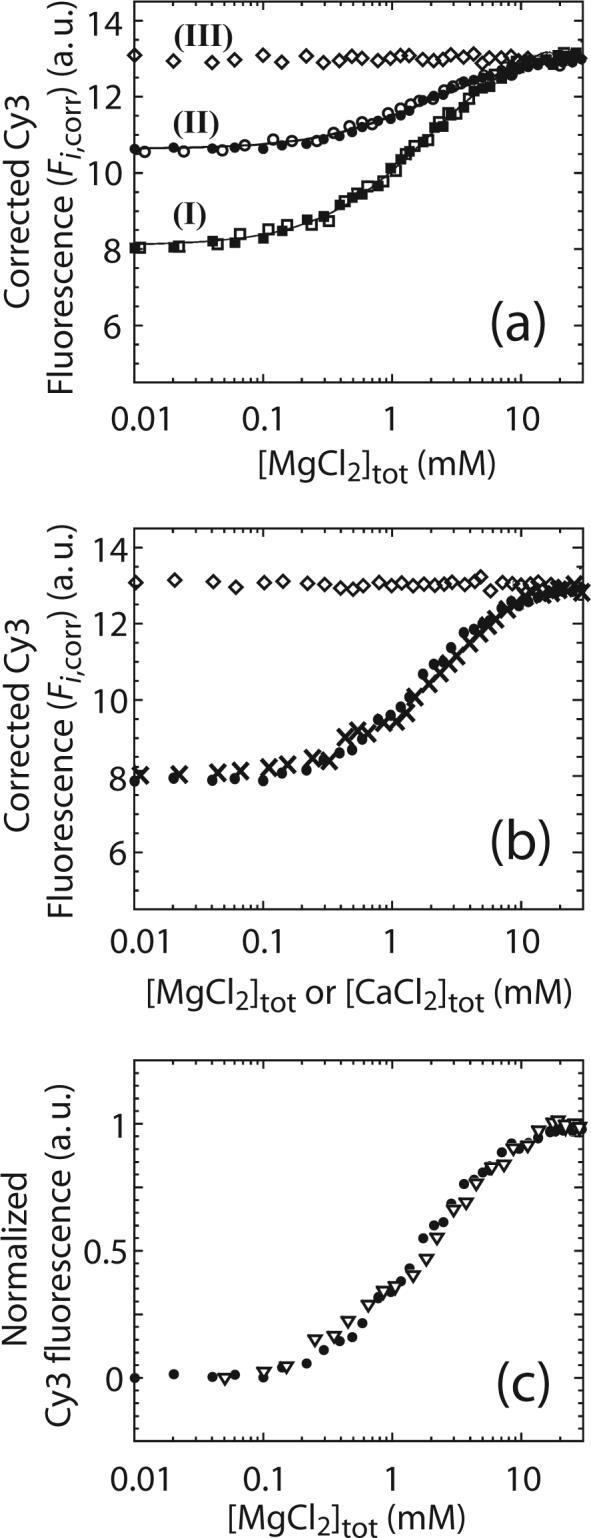
Figure 5.

Effects of Mg2+ on the Cy3 fluorescence signal of a RecBC-reference DNA complex. (a) 10 nM of DNA I (■), DNA II (●) or DNA III (◇) was pre-bound with 2.4, 2.2 or 1.3 μM RecBC, respectively, and titrated with MgCl2 in buffer M plus 100 mM NaCl at 25°C and the corrected Cy3 fluorescence (Fi,corr) was plotted as a function of total [MgCl2]. The same experiments were performed in buffer M plus 400 mM NaCl for DNA I (□) and DNA II (○). Solid lines are simulations using equations (13) to (15) and the best fit values of and (, and (8 ± 3) M−1 respectively). (b) Comparisons of 10 nM of DNA I pre-bound with 2.4 μM RecBC titrated with MgCl2 (●) or CaCl2 (×) in buffer M plus 100 mM NaCl at 25°C. Fi,corr is plotted as a function of total [MgCl2] or [CaCl2]. 10 nM of DNA III pre-bound with 1.3 μM RecBC was also titrated with CaCl2 (◇) in buffer M plus 100 mM NaCl at 25°C. (c) Comparisons of 10 nM of DNA I pre-bound with either 2.4 μM RecBC (●) or 2.4 μM RecBΔnucC (▽) and titrated with MgCl2 in buffer M plus 100 mM NaCl at 25°C. Fi,corr from each experiment was normalized arbitrarily to one and plotted as a function of [MgCl2].
