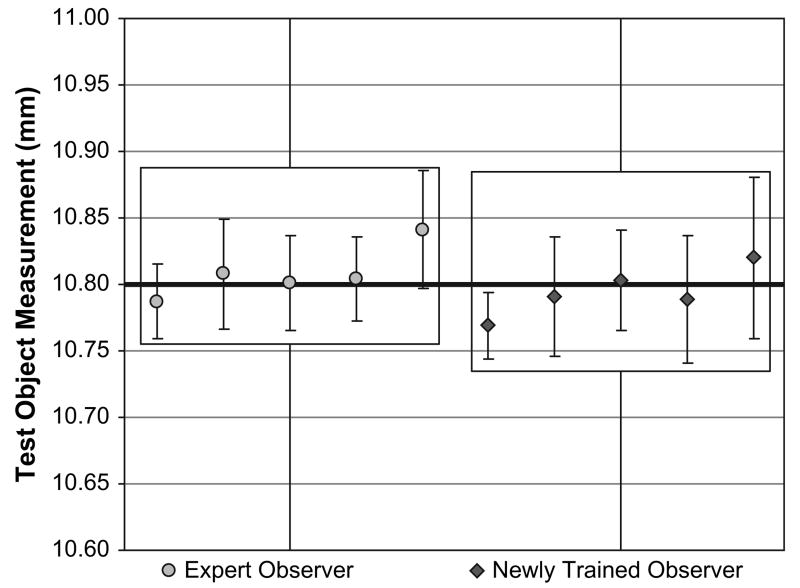
Figure 2.
A repeatability and reproducibility plot for the study data. The mean and standard deviation of each scan set are plotted for the expert and newly trained observer. The thick black line indicates the micrometer derived lateral width (10.80 mm) of the test object. The boxes indicate the overall agreement between observers. The accuracy of the B-scan system is represented by the thick black line bisecting the average of the scan sets. The small range of the error bars represents the high repeatability of measurement. The similar height of the boxes and similar pattern of means across the sequence of 5 scan sets for the 2 observers represent the high reproducibility.

