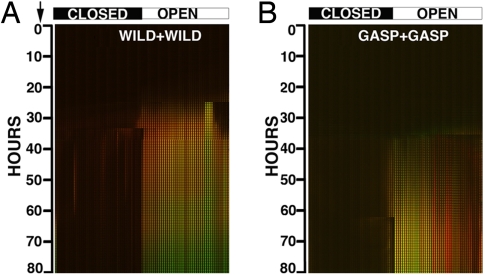
Fig. 2.
Montage of the images obtained from 2 control experiments. (A) Control experiment consisting of JEK1036 (green) and JEK1037 (red) WT in coculture. (B) Control experiment consisting of JEK2032 (green) and JEK1033 (red) GASP mutant in coculture. The image stack corresponds to 80 h of run time, NS opens are shown along the top of the 3 montages, all closed to the Left, all open to the Right.

