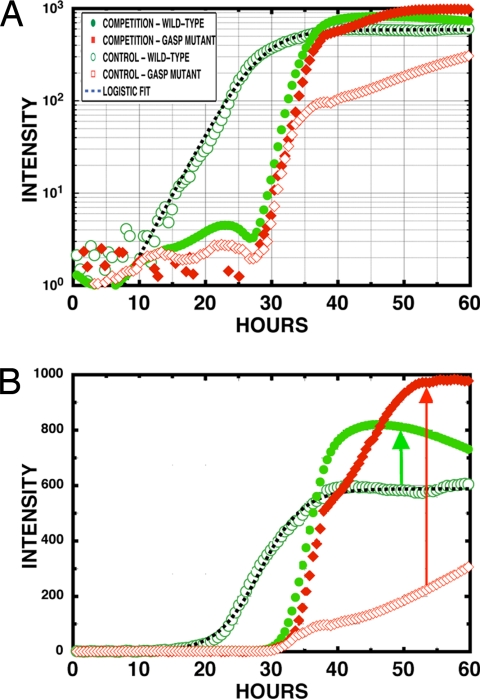
Fig. 5.
Averaged fluorescent intensities in the open region of the array. The open and filled circles are the WT control and competition growth curves, respectively, whereas the open and filled diamonds are the GASP-type control and competition growth curves, respectively. (A) Semilog intensity vs. time. (B) Linear intensity vs. time.

