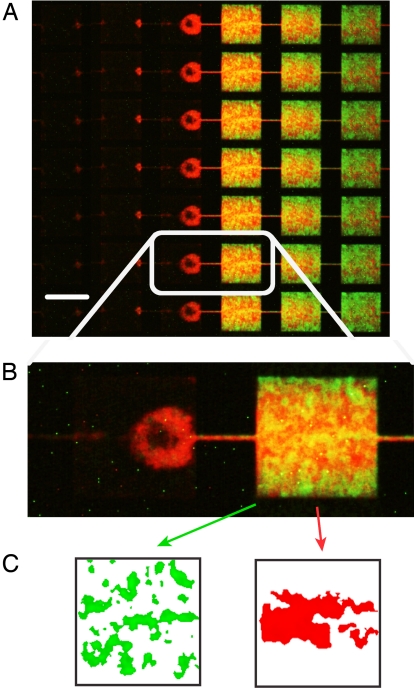
Fig. 6.
Fluorescence images of competing populations in MHPs. (A) True-color image of the fluorescence of the chain of MHPs stacked vertically for JEK1033 (GASP bacteria, red RFP) and JEK1036 (WT bacteria, green GFP) competitive cohabitation. This image corresponds to an enlargement of the interface region between the closed and open regions ≈50 h into the run. (B) Two neighboring patches across the interface between 0 external nutrient diffusion (Left) and full external nutrient diffusion (Right). (C) Result of the cluster size analysis performed on the B, Right patch.

