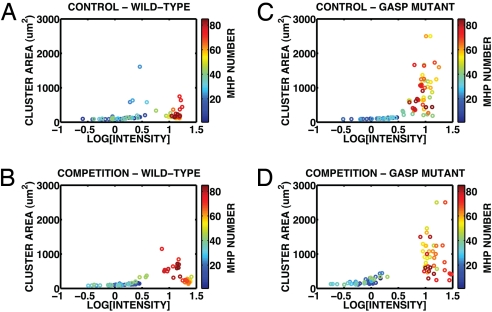
Fig. 7.
Patch size and population density for (A) GASP+GASP JEK1033 control, (B) WT+WT JEK1036 control, (C) GASP JEK1033 competition experiment, (D) WT JEK1036 competition experiment. The MHP numbers are color coded, with lower numbers (closed MHPs) coded blue to blue–green and the higher numbers (open MHPs) coded yellow to red.

