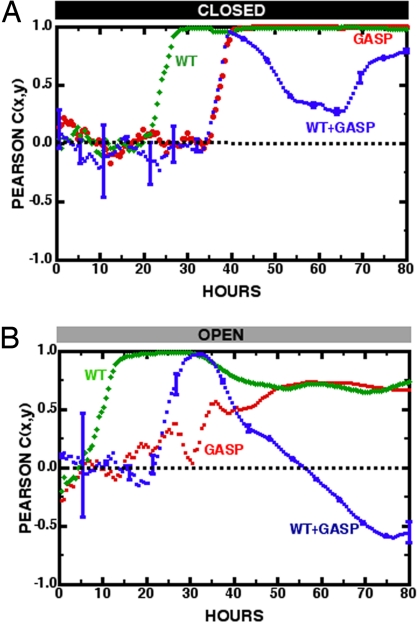
Fig. 8.
Cx,y vs. time in hours after inoculation for the closed and open regions of the MHP array. Error bars are shown for only the WT+GASP competition experiments. (A) Closed region. WT+WT control cross-correlations between red and green strains are green diamonds, GASP+GASP control cross-correlation between red and green strains are red circles, WT+GASP competition cross-correlation between red and green strains are blue squares. (B) Open region. WT+WT control cross-correlation between red and green strains are green diamonds, GASP+GASP control cross-correlation between red and green strains are red circles, WT+GASP competition cross-correlation between red and green strains are blue squares.

