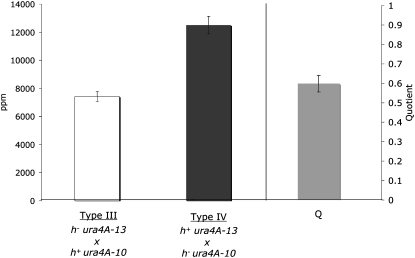
Figure 1.—
The mat-bias at ura4A. The open bar indicates the average of prototrophs per million viable spores of at least four independent type III crosses: h− ura4A-13 (EPY5) × h+ ura4A-10 (EPY12) or type IV crosses: h+ ura4A-13 (EPY6) × h− ura4A-10 (EPY11). The shaded bar represents the mean quotient of type III and type IV (in ppm), which was determined as the average of the quotients of all type III/type IV values. Error bars stand for standard error on the mean.

