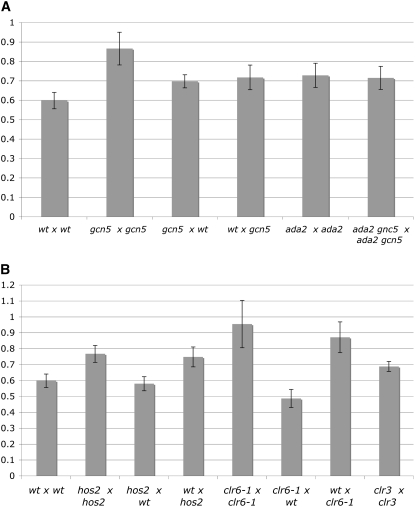
Figure 3.—
The mat-bias in HAT and HDAC mutants. Shaded bars indicate the ppm quotient average of type III and type IV crosses in HAT mutants (A) or in HDAC mutants (B), which were independently repeated at least three times (supplemental Table S2). The y-axis represents the quotient of type III and type IV (in ppm) crosses. Type III crosses were (A) EPY5 × EPY12, EPY7 × EPY14, EPY5 × EPY14, EPY7 × EPY12, EPY48 × EPY49, and EPY65 × EPY64, respectively; (B) EPY5 × EPY12, EPY9 × EPY16, EPY9 × EPY12, EPY5 × EPY16, EPY76 × EPY77, EPY76 × EPY12, EPY5 × EPY77, and EPY86 × EPY87, respectively. Type IV crosses were (A) EPY6 × EPY11, EPY8 × EPY13, EPY8 × EPY11, EPY6 × EPY13, EPY47 × EPY50, and EPY66 × EPY63, respectively; (B) EPY6 × EPY11, EPY10 × EPY15, EPY10 × EPY11, EPY6 × EPY15, EPY75 × EPY78, EPY75 × EPY11, EPY6 × EPY78, and EPY85 × EPY88, respectively. Error bars stand for standard error on the mean.

