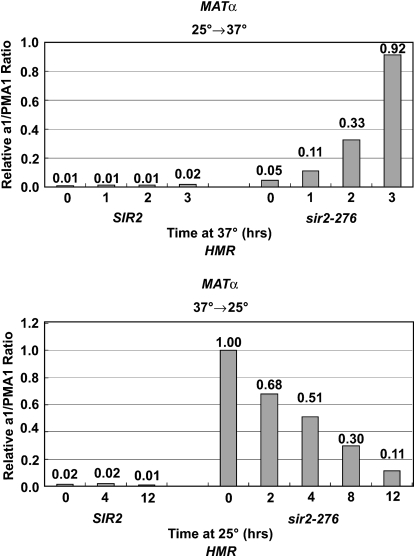
Figure 5.—
Measurements of a1 mRNA from HMR after temperature shifts of MATα SIR2 and sir2-276 strains. Cells were grown at 25° for 2 hr and raised to 37° for 0, 1, 2, and 3 hr (top), or grown at 37° for 2 hr and dropped to 25° for 0, 2, 4, 8, and 12 hr (bottom). cDNAs collected at different time points were amplified with primers to a1 and PMA1 and RNA was quantified as in Figure 2.

