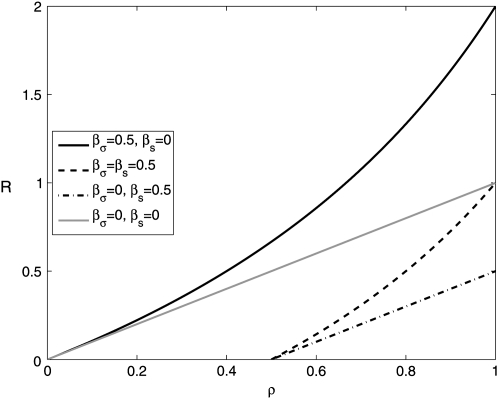
Figure 3.—
Ratio of transmission to growth mutants, R, with and without pleiotropic effects. We show a situation where a growth mutation leads to a reduction in survival ( , a transmission mutation leads to a reduction in growth rate
  , dashed line), and for both growth and transmission mutations, a reduction in the other trait occurs
  , dashed-dotted line). For comparison, we also plot the case of no pleiotropy (
 , shaded line). In all cases,
  . Changing either
  or
or  decreases or increases the slope of R, as seen from Equations 8 and 13.

