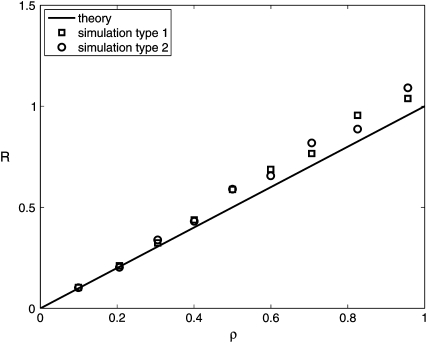
Figure 4.—
Ratio of transmission to growth mutants, no pleiotropy. Solid line: analytics. Squares: mutants can arise only during the first growth cycle, corresponding to the theoretical model. Circles: mutants can arise at any time during the evolution. See text for more details on the simulations. Parameters are N0 = 103, N1 = 107, μs = μσ = 10−7 (Rozen et al. 2002; Perfeito et al. 2007), αs = ασ = 40 (Rozen et al. 2002). For each data point, 5 × 10⁶ (squares) or 103 (circles) simulations were run.

