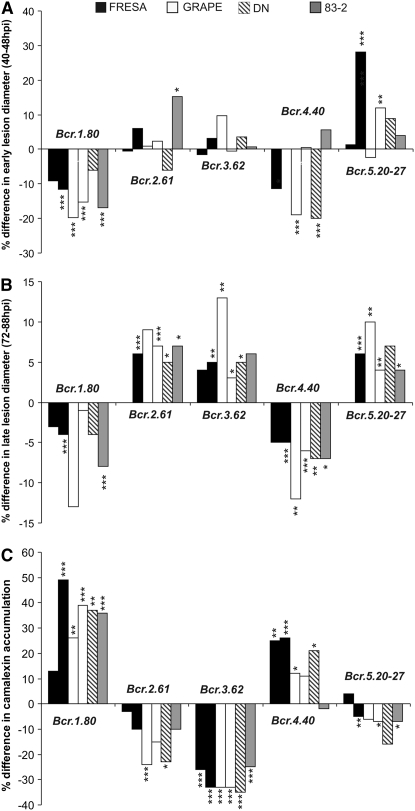
Figure 3.—
Estimated phenotypic effect of substituting the Bay-0 allele for the Shahdara allele at markers associated with five QTL clusters. The vertical axis shows the percent difference in trait mean between all RILs carrying the Bay-0 allele vs. all RILs carrying the Shahdara allele at the queried locus. Bar shading differentiates B. cinerea isolates, as indicated in the figure legend. Two values each are presented for isolates GRAPE and FRESA, representing experiments A and B. Significance of QTL as determined by ANOVA (Tukey's HSD) is indicated by asterisks above bars (*P < 0.05; **P < 0.01; ***P < 0.001). Trait means, standard error, and specific P-values for Bay-0 and Shahdara alleles at these QTL regions are presented in supplemental Table 2. Traits: (A) early (48 hpi) B. cinerea lesion (centimeter lesion diameter); (B) late (72–88 hpi) B. cinerea lesion (centimeter lesion diameter); and (C) camalexin accumulation (nanograms/square centimeter leaf area).

