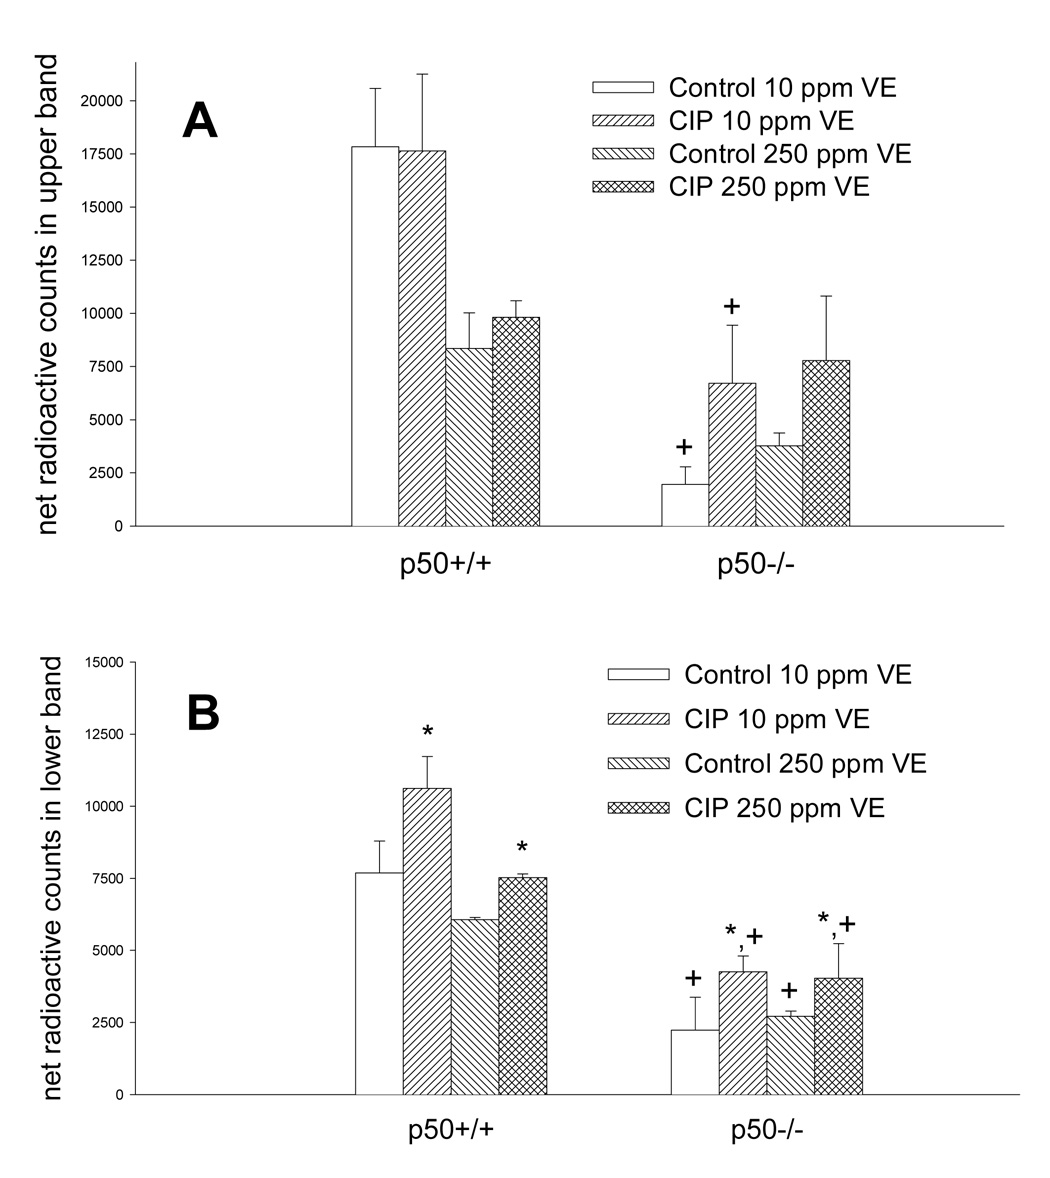
Figure 4.

Net radioactive counts of NF-κB bands from the EMSA data (Figure 3). Quantitation of the upper NF-κB band (A) and the lower NF-κB band (B) was determined by subtracting background counts from the total counts in each NF-κB band. *Values are significantly different from respective untreated controls. +Values are significantly different from the p50+/+ group receiving the same treatment (p<0.05).
