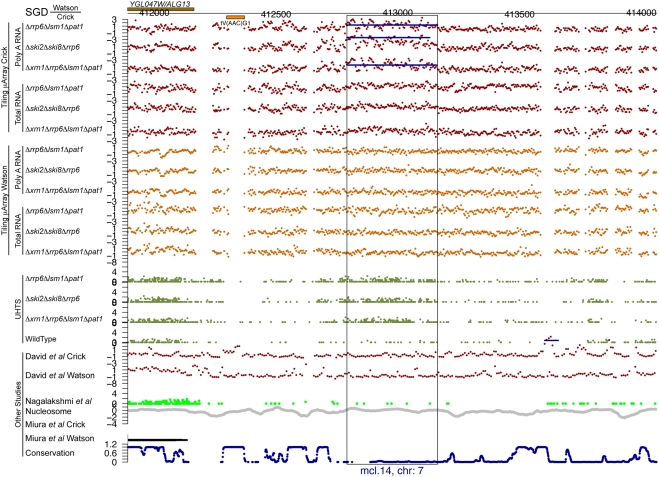
Figure 5. An unannotated transcript found in this study.
There are the following information tracks from top to bottom: SGD annotation on the Watson and Crick strands, our tiling microarray data from the Crick and Watson strands (poly A+ RNA above total RNA), our UHTS data for the mutant and wild-type strains, tiling microarray data from David et al. for the Crick and Watson strands, UHTS data from Nagalakshmi et al., nucleosome position, data from Miura et al., and degree of conservation. The name and chromosome of origin of each transcript are indicated below. For the UHTS data, each point plotted corresponds to the 5′ end of sequence reads, and the position of the plotted point above the axis indicates (on a log scale) how many reads mapped to that position. Horizontal lines in a track indicate novel segments found in the corresponding study (black for forward strand and blue for reverse strand).

