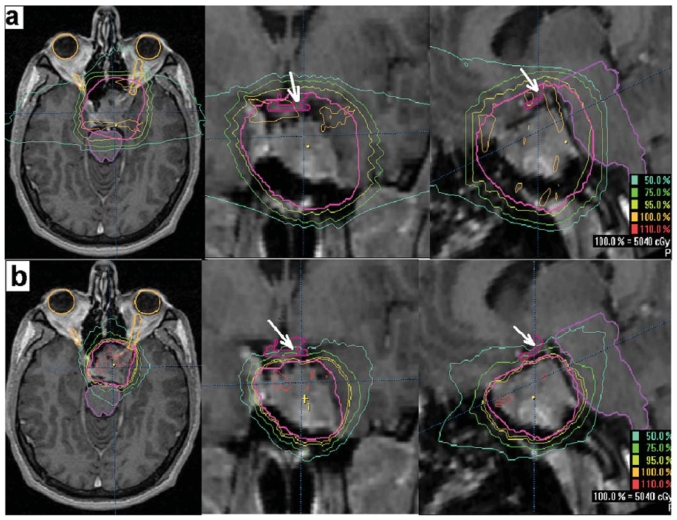
FIGURE 3.
Axial, coronal, and sagittal magnetic resonance imaging slices with isodose distributions from (a) conventional 3-field technique, showing coverage of the planning target volume (ptv) and optic chiasm by the 95% isodose surface; and (b) 5-field fractionated stereotactic radiotherapy technique showing coverage of the ptv by the 100% isodose surface, while keeping the optic chiasm (arrow) outside the 75% isodose surface.

