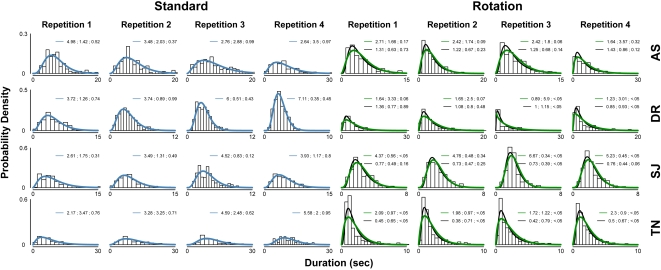
Figure 4. Experiment 2 phase distributions.
Gamma distribution fits (blue) for the standard walker data are presented on the left-hand side, and both gamma (green) and lognormal (black) fits for the rotating walker appear on the right. In applying these fits, some data points at the upper extreme (2% longest durations) were excluded to improve the quality of the fit [33]; however, the 2% shortest durations were retained, as quite often observers' experienced percept durations less than 1 s, making the filtering of error button responses problematic. The distributions contain on average over 200 data points. The numbers above each histogram represent the fitted parameters and quality of fit: shape, scale, p-value (gamma); mu, sigma, p-value (lognormal). A p-value greater than 0.05 given by the Kolmogorov-Smirnov test represents a fit of acceptable quality.

