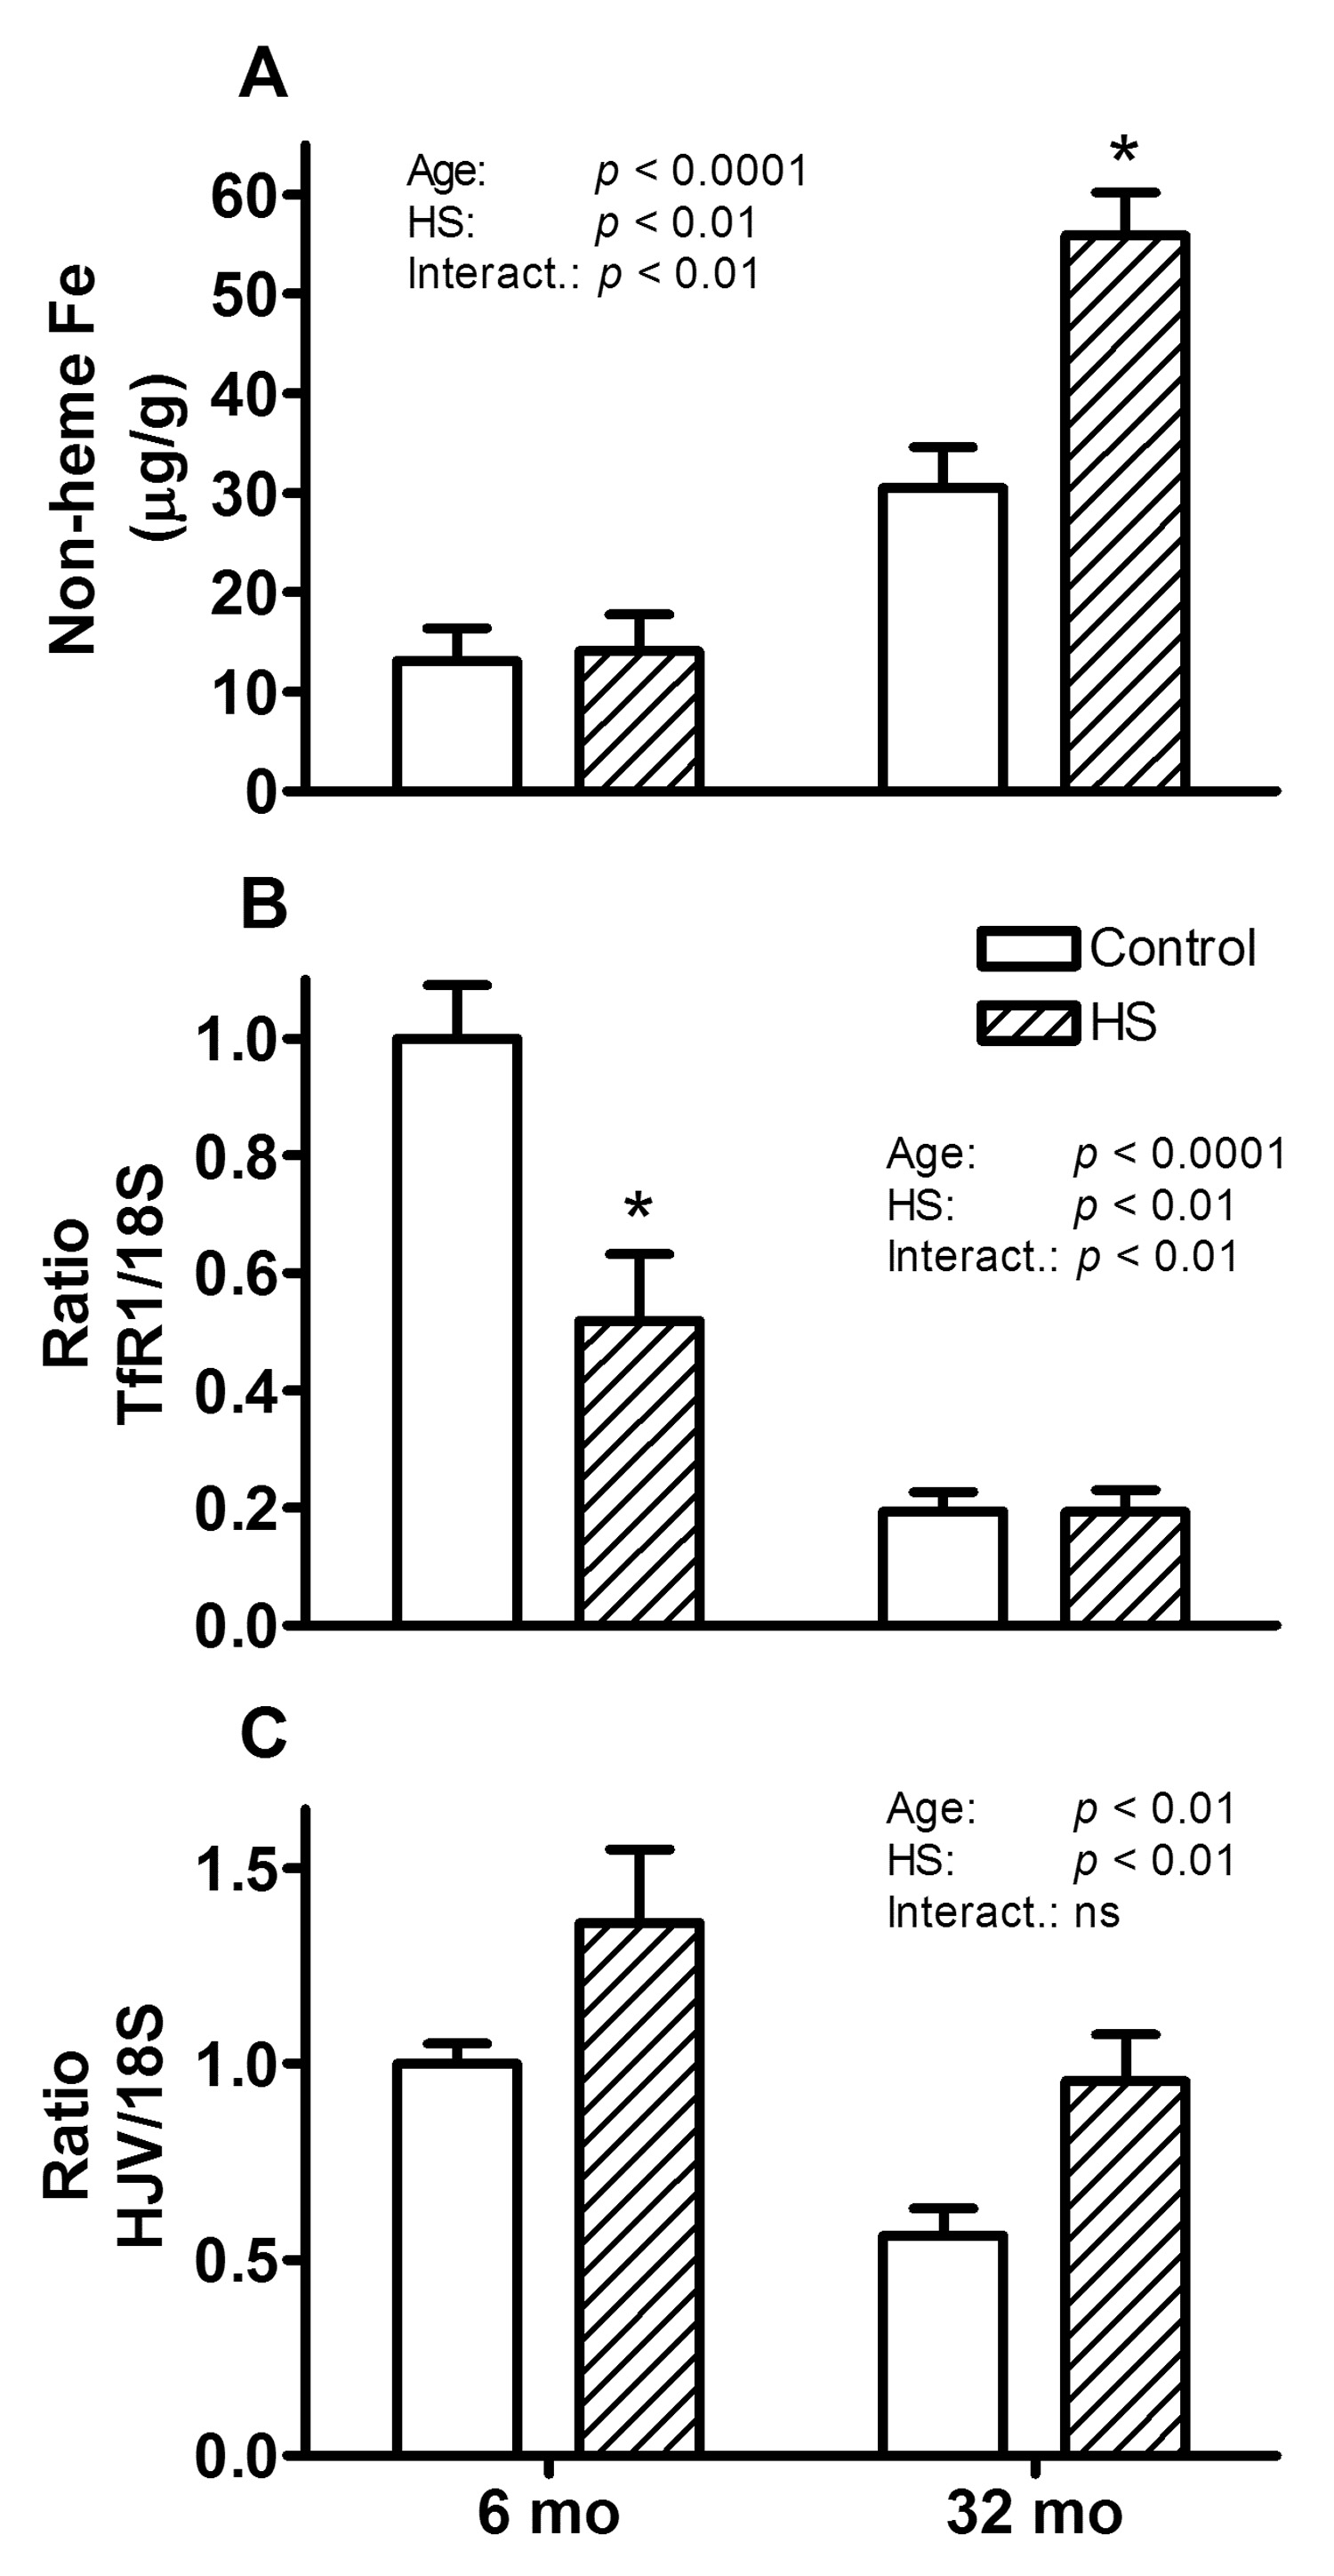
Figure 2. Changes in non-heme iron, TfR1, and HJV mRNA levels with atrophy.

Non-heme iron concentration (A) and relative TfR1 (B) and HJV (C) mRNA levels of gastrocnemius muscles from 6 and 32 month (mo) old control (open bars) and HS (hatched bars) rats are shown. For all three parameters, a main effect for age and HS was observed. The * indicates a significant difference for HS within the age group.
