
Figure 6.
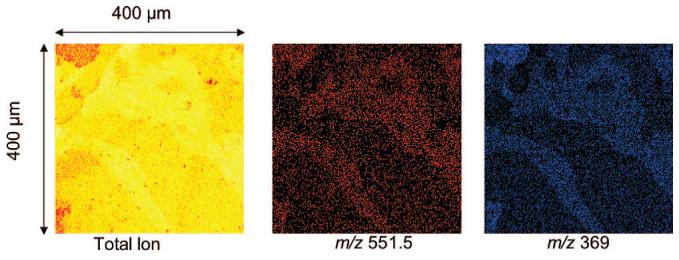
Mass spectral images of the DPPE/cholesterol/glycophorin A LB film (total ion = 0–382 counts, m/z 551.5 = 0–3 counts, m/z 369 = 0–9 counts).
Official websites use .gov
A
.gov website belongs to an official
government organization in the United States.
Secure .gov websites use HTTPS
A lock (
) or https:// means you've safely
connected to the .gov website. Share sensitive
information only on official, secure websites.
Mass spectral images of the DPPE/cholesterol/glycophorin A LB film (total ion = 0–382 counts, m/z 551.5 = 0–3 counts, m/z 369 = 0–9 counts).