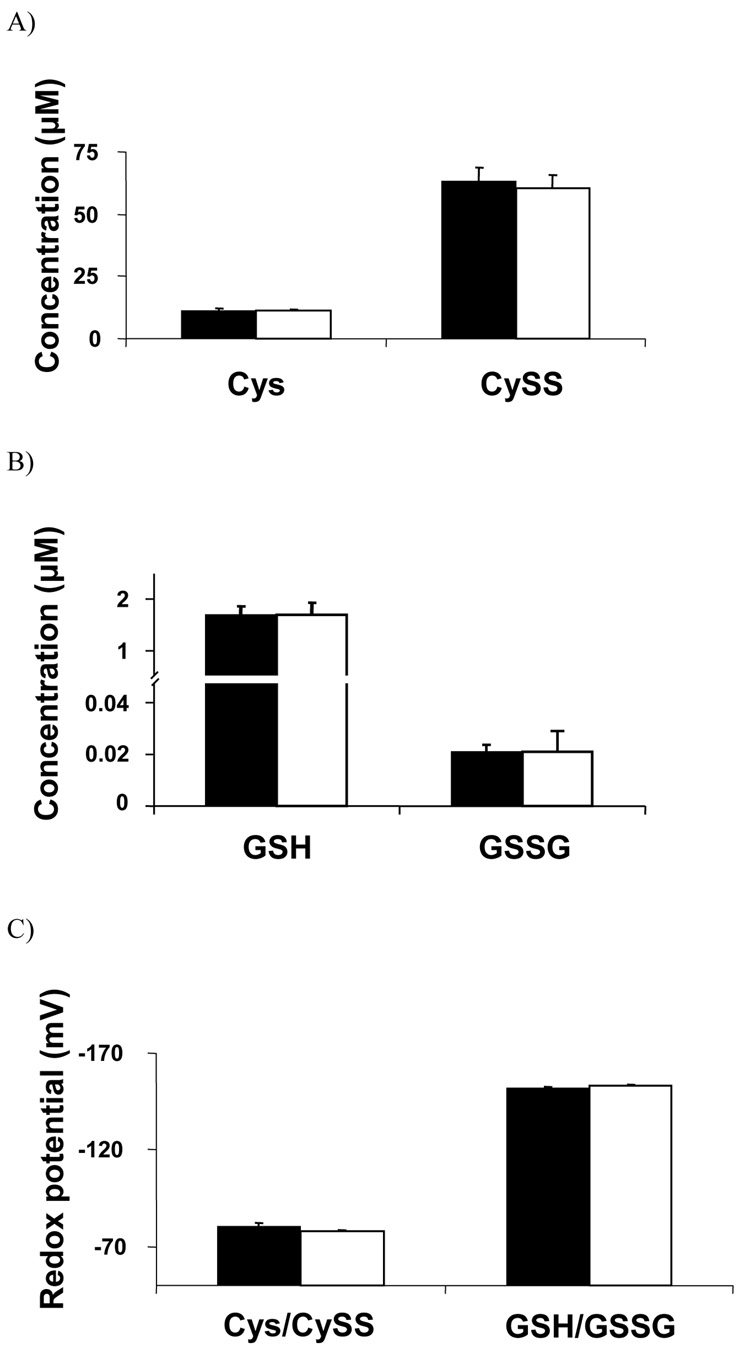
Figure 3. Comparison of LC-FTMS method to previously validated HPLC with fluorescent detection method for analysis of Cys, CySS, GSH and GSSG concentration and steady-state redox potential values.
A) The concentrations of Cys (11.2 ± 0.7, 11.0 ± 0.4, p=0.73) and CySS (63.4 ± 5.5, 60.5 ± 5.5, p=0.95) were not significantly different between the two methods. B) The concentrations of GSH (0.026 ± 0.2, 1.7 ± 0.2, p=0.94) and GSSG (0.024 ± 0.002, 0.026 ± 0.01, p=0.72) were not significantly different between the methods. C) The steady-state redox potential for the Cys/CySS couple (−76.6 ± 1.5, −77.8 ± 0.8, p=0.16) GSH/GSSG couple (−152.1 ± 0.4, −152.9 ± 0.7, p=0.36) was not significantly different between the 2 methods. All samples were run in quadruplicate. All values are mean ± standard error. S-carboxymethyl-cysteine, CM-Cys; cystine, CySS; S-carboxymethyl-glutathione, CM-GSH; glutathione disulfide, GSSG; [1’,2’ 13C]-S-carboxymethyl-cysteine, [13C2]-CM-Cys; [3,3’ 13C]-cystine, [13C2]-CySS.

